


The Strat Trading Strategy Explained For Beginners
The Strat Trading Strategy teaches clear trade setups and risk controls for beginners. AquaFutures provides funded accounts for real-market trading.

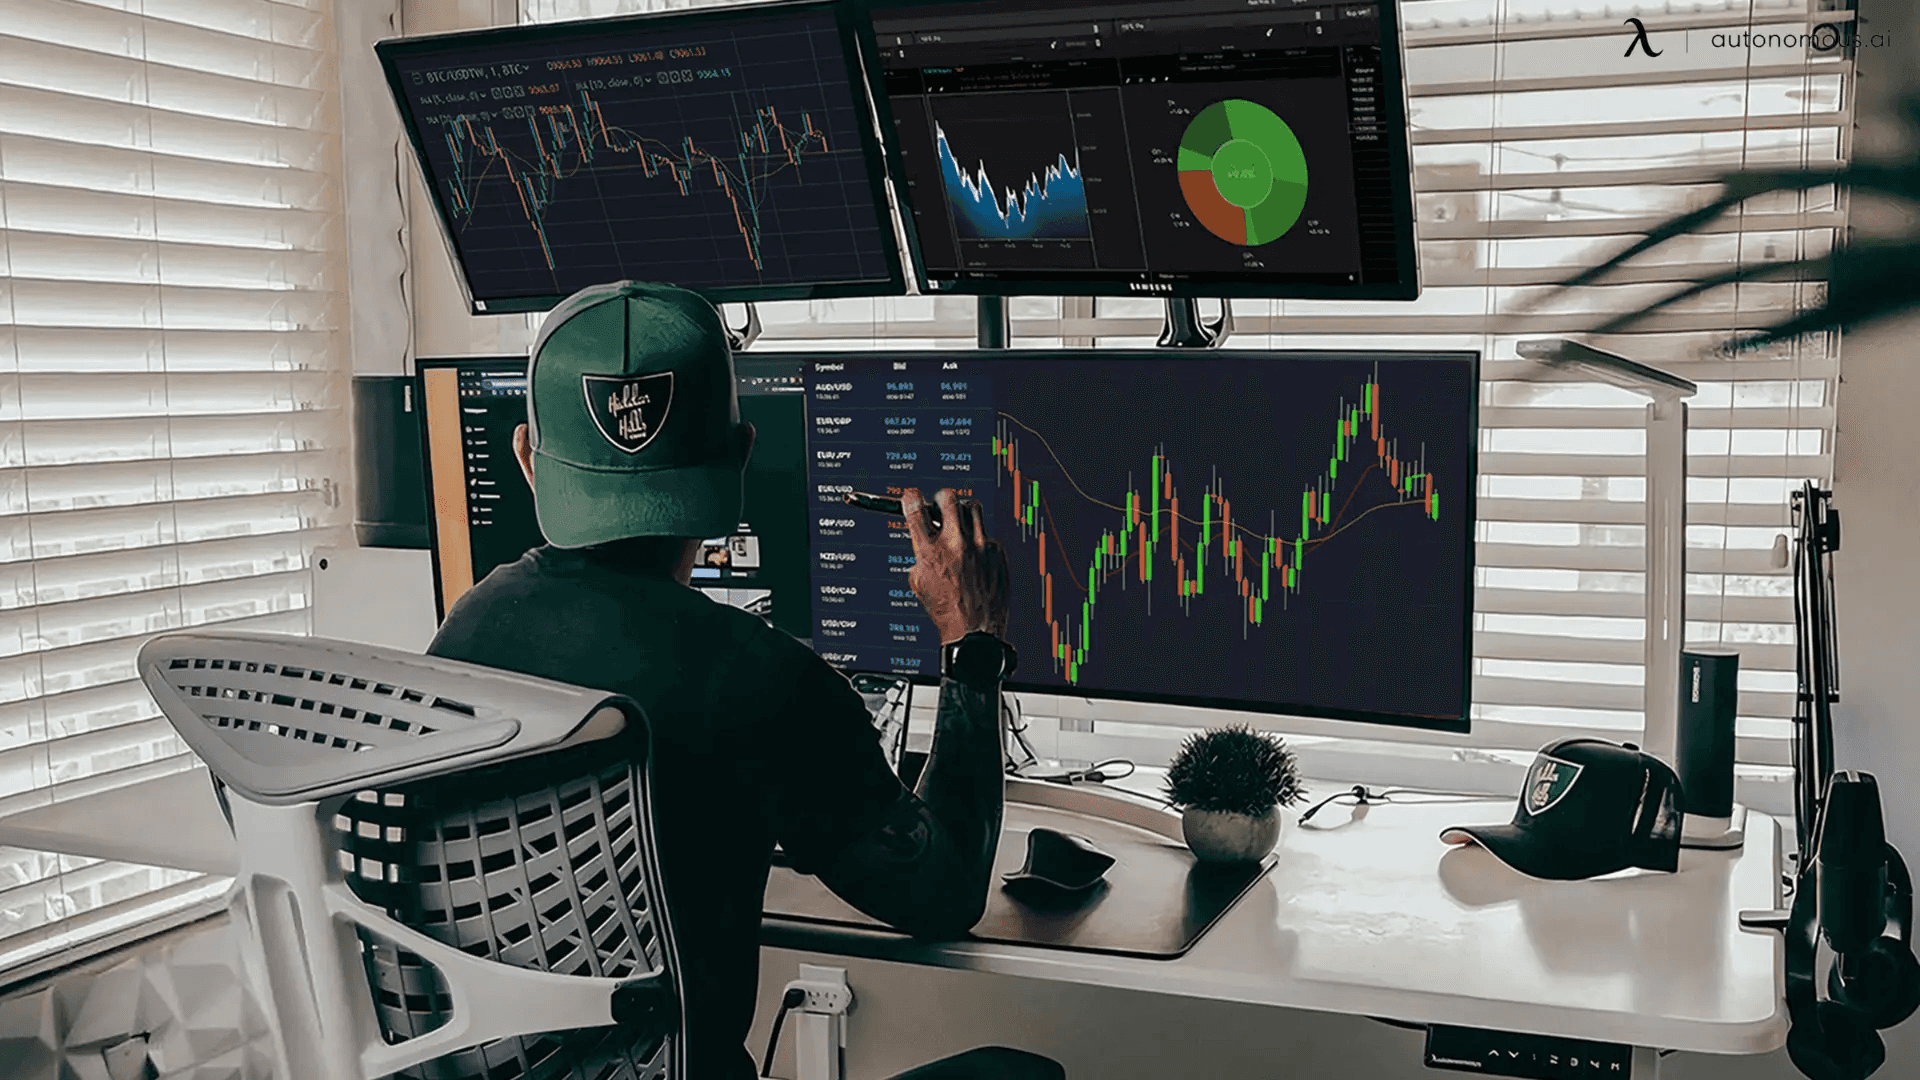
Traders often encounter uncertainty when reading charts, wondering if a particular candle signals a trend or a false alarm. Examining Trading Patterns such as candle types, wicks, session bias, market structure, and order flow transforms guesswork into actionable insights. Clear indicators help identify high-probability setups and remove emotion from each trade, promoting a systematic approach to market analysis.
Effective chart reading and rule-based frameworks allow traders to execute consistent strategies and manage risk with greater confidence. For those seeking a practical environment to refine these techniques in real-size trading scenarios, AquaFutures offers funded accounts for futures trading, a service that facilitates disciplined entry and exit decisions.
Summary
- The Strat turns specific two and three-bar candlestick arrangements into repeatable signals, and over 70% of traders using The Strat report improved trading outcomes when they apply the ruleset with discipline (STAT Trading, 2025).
- Discipline and risk control are the common failure points, not the patterns; disciplined users see measurable operational benefits, with a reported 25% increase in trading efficiency when The Strat is paired with strict execution routines (STAT Trading, 2025).
- Signal quality is driven by multi-check governance. The framework includes 50 discrete measures, and about 75% of STRAT components focus on quality improvement, reducing single-point failures, and ambiguity in live trading.
- Execution friction materially erodes edge; YieldFund reports a 20% increase in transaction costs for traders using The Strat. Therefore, forward testing at realistic tick sizes and at least 100 live-sim trades is essential to capture true slippage.
- Scaling by simply adding capital hides operational risk, and adoption has grown rapidly, with more than 10,000 traders worldwide using The Strat, underscoring the need for governance and controlled experiments before size increases.
- Operational monitoring prevents silent drift, for example, using rolling 50-trade expectancy checks and automatic pause triggers, because YieldFund also reports that The Strat can carry about a 15% higher risk of loss versus some traditional strategies if controls are absent.
- This is where AquaFutures' funded accounts for futures trading fit in, providing simulated capital up to $450K and defined profit targets such as 6 percent so traders can practice execution, sizing, and governance under realistic account rules.
What is the Strat Trading Strategy?

The Strat is a way to read price movements that turns certain two- and three-bar candlestick patterns into trading signals you can use repeatedly. Discipline and context decide if a pattern gives you an advantage or is just noise. It mainly serves as a set of rules, with a focus on philosophy: learn the setups, ensure alignment with higher timeframes, size your trades to match your maximum loss, and let your actions confirm the model. For traders interested in improving their practice, consider exploring funded accounts for futures trading that can help enhance your trading experience.
How does The Strat create repeatable entries?
When used correctly, entries come from pattern and context, not just hope. Traders look for a clear multi-bar setup that fits the overall market trend, then set a specific stop and a reasonable target to manage risk. This method stops guessing and encourages a steady approach, making more small, well-managed trades instead of waiting for a big 'perfect' move. Data from STAT Trading's 2025 report, "Over 70% of traders using The Strat report improved trading outcomes," shows that disciplined, repeatable application tends to translate into measurable improvement for many users, highlighting the importance of execution routines and pattern recognition.
When does The Strat fail?
This method breaks down when discipline falters or the market environment changes faster than the established rules. The common pattern is not based on bad signals but rather on human behavior: failing to honor stop-loss orders, increasing position size after a loss, or trading during periods of thin liquidity and important news. This challenge is clear in both retail and prop accounts, where traders who ignore their planned stop-loss levels or chase outsized returns often end up losing their accounts. Such exhaustion not only leaves individuals feeling burned out but also erodes trust in their strategies. To use The Strat as a career tool, it is vital to treat risk control as the primary signal.
What does using The Strat look like while scaling performance?
For those aiming for steady funded-account growth, The Strat is a great choice. It focuses on repeatable setups and a clear risk per trade. This method rewards a disciplined approach, with targets that are modest and achievable rather than overly ambitious. In practice, many traders improve their performance and lessen emotional whipsaw by tracking their win rate, average R, and trade frequency.
Looking at these metrics shows that following a good process is better than just being hopeful. Also, a study by STAT Trading, titled "Traders using The Strat have seen a 25% increase in their trading efficiency," shows that this framework can help reduce learning times when paired with disciplined routines, serving not as a quick fix but as an efficiency multiplier. For traders looking to explore options, funded futures accounts can provide additional support in scaling their performance.
How should you judge whether The Strat is worth adopting right now?
Focus on edge per trade and the behavioral cost of following the rules, instead of aiming for backtest perfection. If you can stick to set losses, clear position sizing, and a regular review cycle, the Strat becomes a helpful tool for gaining small, steady advantages. However, if you find it hard to maintain stops, or if your emotions change after two losses, no indicator can help; focus on fixing those control points first.
What separates hobbyists from professionals?
That simple promise sounds complete; however, the hidden elements that make patterns tradeable are what truly separate hobbyists from professionals.
Related Reading
- What Is a Funded Trading Account
- What Is SMT in Trading
- Price Action Trading
- Intraday Trading Tips for Today
- Can Day Trading Be Profitable
- Trading Indicators
- Forex Trading Candlestick Patterns
- Intraday Algorithmic Trading
- Trading Candlestick Patterns
- Volatility Trading
What are the Key Components of the STRAT

The components in question are practical tools designed for timing and risk control, not just decorative items. Each component provides different types of information, such as hesitation, conviction, volatility, cross-timeframe agreement, and range behavior. It's important to use specific execution rules to ensure signal quality performs well under real trading conditions, especially if you're interested in our funded futures accounts.
Inside Bars
Inside bars represent a crucial concept in price action trading. An inside bar forms whenever the latest price bar stays entirely enclosed by the range of the one before it. This means its peak and trough do not exceed those of the prior bar. This setup indicates a moment of market hesitation: trading activity tightens after a strong move, with buyers and sellers reaching a temporary balance.
In the STRAT approach, inside bars act as pivotal markers, indicating that the market has hit a neutral zone. This indicates the market is preparing for a decision on its next price path. Traders watch these for breakout opportunities. A follow-on bar that extends beyond the inside bar's boundaries can signal a new trend or continue an existing one, providing a low-risk entry when it aligns with broader market signals.
Directional Bars
A directional bar shows up when the latest bar goes beyond either the upper or lower edge of the previous bar. This clearly shows momentum in one direction without confusion. It can appear as an upward move that breaks the previous high or a downward move that goes below the previous low, indicating clear action by market participants.
In the STRAT framework, these bars provide important signals about emerging trends or potential shifts in momentum. They help traders understand the strength of buyers or sellers in control. By spotting directional bars early, investors can position themselves with the current force. Traders often use them to confirm continuations or to predict changes when price action opposes the main trend across various charts.
Outside Bars
Outside bars occur when the current bar exceeds both the previous bar's highest and lowest points, covering its entire range and indicating increased volatility within a single period. This pattern shows a quick expansion in which initial moves in one direction reverse, resulting in a close that shows who wins between bulls and bears.
In STRAT trading, outside bars act as signals for possible turning points or faster changes in price action, often showing that the current direction might be running out of steam or about to reverse. Traders use these for strong setups, especially when they appear at important support or resistance levels, as they can hint at big swings and provide clear places for stop-loss orders based on the edges of the bar.
Full-Time Frame Continuity
Full-time frame continuity means examining price behavior across different chart time intervals. This helps determine if trends are moving together in a bullish or bearish way. You check shorter time frames, such as hourly or daily, against longer ones, such as weekly or monthly, to identify shared momentum or differences.
As an important part of the STRAT method, this continuity enhances trade reliability by identifying situations where all levels agree, increasing the likelihood of trades with favorable odds. On the other hand, when time frames do not align, it signals weakening trends or potential changes. This helps traders avoid low-probability trades and instead focus on stable trends, reducing risk through layered confirmation.
Broadening and Contracting Markets
Broadening markets occur when price ranges get wider over time. This means the highs continue to rise, and the lows continue to fall, creating patterns such as expanding wedges. These patterns often indicate increasing market uncertainty. On the other hand, contracting markets show narrower ranges, with highs and lows closer together. This usually builds tension before a breakout happens.
In the STRAT strategy, noticing these patterns helps traders see what might happen next in the market. Broadening formations often precede reversals, indicating the market may be overextended. Contracting setups, on the other hand, suggest that a major move is imminent. Traders use these setups to determine when to enter the market, employing broadening signals for potential tops or bottoms and contracting phases for breakout trades. This strengthens their decision-making by combining these insights with other STRAT tools to improve predictions.
What checklist can traders follow?
- Make sure you see a breakout bar after an inside bar before you commit.
- Size your trades based on a fixed tick or dollar risk, not on an emotional fraction of your account.
- Choose directional bars that exceed the recent ATR, supported by higher timeframes.
- Treat outside bars as important events and reduce your size.
- In shrinking markets, set wider targets; in expanding markets, prefer mean reversion at the extremes.
How do emotional patterns affect trading?
Trading behavior breaks the rules more often than markets do. This is where human patterns matter: traders can get tired, and as their self-control fades, a single failure to follow a planned exit can turn a small loss into a big loss. The emotional impact of that failure is both real and common; it’s draining to see months of hard work disappear because a stop was ignored instead of followed. Although the technical fixes mentioned above are minor, they can stop the emotional spiral that undermines accounts.
Is there evidence of repeatable profit?
The curiosity loop raises an important question: even though the structure appears useful, the key question is whether these rules can generate repeatable profit in real-world situations.
Does the Strat Trading Strategy Work?

The Strat can generate real, tradable edges when matched with the right trader and account rules. However, it only works if the human parts are forced to follow a routine like a machine. It serves as a tool for steady performance, not a shortcut to outsized alpha; success depends on keeping a disciplined size, realistic throughput, and constant validation against real trading friction.
The Strat trading strategy has attracted investor attention because it may deliver results across different market environments. While it is not a guaranteed system, it has shown promise for users who apply it carefully, providing a systematic approach to trading. This method focuses on data-driven evaluations rather than gut feelings, making it suitable for a range of asset classes, including stocks and futures. Its main ideas help explain price movements clearly, improving clarity and effectiveness.
What evidence do users provide about The Strat?
Many traders report success with the Strat. They note that it helps clarify market behavior and support smarter decisions. Discussions on online forums like Reddit often show users sharing how the Strat has improved their results, especially in finding reversals and trends. For example, some users highlight its usefulness in futures trading, noting better performance on longer time frames. This feedback matches what others say about the strategy's help in reducing emotional trades.
What do backtesting results show for The Strat?
Backtests show that The Strat can produce solid returns under certain conditions. One analysis found an annualized return on investment of approximately 14.73%, with trades held for an average of about two weeks. A Reddit backtest of automated versions showed that shorter time frames, such as one-minute candles, achieved a 35% win rate and a profit factor of 1.786 over two weeks, despite fewer trades.
How does the community support The Strat?
The Strat benefits from a strong online community that shares insights and refinements. This makes it more appealing. Platforms like GitHub offer resources that help teams collaborate on applying the strategy in stock trading. Traders on X (formerly Twitter) often share their amazing results. One user said it improved their consistency by focusing on candlestick patterns. Another user shared a video breakdown that achieved an 81% win rate in related price-action tests, though it was adjusted.
What do competitors say about The Strat?
Competitive analyses, such as those on TrendSpider, recognize The Strat's proven track record. However, it is important to understand that this strategy does not work for everyone. While it is great for multi-timeframe analysis, it also requires complementary risk management. Discussions on Forex Factory highlight the importance of testing on pairs such as EURUSD. Users recommend that some entry points are best on certain time frames. Many have reported consistent profits by using tailored trading strategies.
How can you measure improvement with The Strat?
How can you measure if The Strat really improved your results? Use relative, time-bound measures, not just stories. Compare two six-week periods: one using your previous discretionary method and the other strictly following the Strat rules, making sure they have the same size and hours.
Track average R per trade, trades-to-target, the worst five-trade drawdown, and the psychological cost, like how many times you broke a rule after a loss. If you notice a steady increase in trade efficiency and a decrease in impulsive rule breaks, you have something that’s worth expanding. This is why STAT Trading found that over 70% of traders using The Strat reported improved trading outcomes (STAT Trading, 2025). Think of The Strat like a finely crafted wristwatch: it is accurate only when it is cleaned, wound, and kept free of dirt. If left unattended, even a single grain can jam the gears, causing time to stop.
What is the most common operational gap for traders?
This solution works well until traders encounter the one operational gap most never measure.
How to Use the Strat Strategy in Trading
Use the Strat as an execution system, not just a list of signals. Select specific sessions and instruments for trading; set your tick or dollar risk, and automate order rules when you can. Treat each setup like an experiment, including entry, exit, and slippage. By doing so, the Strat moves beyond its theoretical roots and becomes a scalable, repeatable workflow.
How do you identify bar types?
The first step in applying the strat strategy is to classify the current price candle into one of three groups based on its relationship to the previous candle. These groups are inside bars, where the whole range fits inside the last one; directional bars, which break the high or low but not both; and outside bars, which go beyond both the high and low of the last candle. This classification helps traders assess immediate market sentiment, indicating whether it signals a stable market, a clear trend, or increased volatility from competing forces.
In practice, identifying these groups forms the base of the Strat approach by giving clear signals without emotional bias. For instance, spotting a directional bar can confirm momentum in a trend, while an outside bar might indicate a potential shift. This helps traders position themselves effectively when combined with other factors, such as support levels. This careful labeling ensures decisions are based on visible price action, improving consistency across assets such as stocks and forex.
What does analyzing multiple timeframes involve?
Once bars are identified, the next phase is to check price movements across different chart intervals to see if they align in direction. This may involve comparing short-term views, such as hourly charts, with longer ones, such as daily or weekly, to determine whether bullish or bearish tendencies align. This analysis shows overall market strength when signals align across time frames; mismatches indicate caution or potential changes.
In the Strat framework, this review across multiple timeframes, often called full-timeframe continuity, removes noise and improves the chances of successful trades by confirming the bigger picture. For example, a bullish directional bar on a daily chart appears stronger if both the weekly and monthly frames also show continuity upward, helping guide lower-risk entries. Traders benefit from this layered perspective, as it avoids overreliance on single signals and provides a comprehensive view of market dynamics.
How do you spot broadening formations?
Broadening formations emerge when price ranges expand over time. They show successive highs and lows, often with a mix of directional and outside bars. These patterns signal growing uncertainty and volatility. This can lead to significant moves, such as reversals if one side becomes exhausted, or expansions that sustain the trend. Spotting them early allows traders to anticipate key turning points or accelerations in price behavior.
In the Strat methodology, these formations are critical for trade timing. They often precede changes by signaling overextended conditions. For instance, a series of outside bars forming a broadening wedge may signal an upcoming reversal. This could lead traders to set protective stops or take opposite positions. By combining this with bar types, investors can sharpen their strategies. They can use the patterns to align entries with high-probability scenarios and manage risk by clearly defining risk parameters.
What are the key Strat patterns?
Strat patterns are specific sequences of bar types that provide actionable setups. One example is the 1-2D inside break, where an inside bar (scenario 1) is followed by a downward directional bar (2D). This signals a possible downside breakout from consolidation. Other common patterns include the 1-2U-2D inside reversal, which combines an inside bar with an upward directional bar, followed by a downward directional bar, to indicate a market shift.
There's also the 1-3-1-2D volatility expansion, which involves an inside bar, an outside bar, another inside bar, and a downward directional bar, showing increased market movement. The 2D-2D continuation is for sustained bearish momentum. The 2U-2D reversal is for trend flips. The 3-2D range expansion continuation amplifies downward trends after an outside bar. Lastly, the 3-2U-2D broadening reversal highlights potential upward turns in volatile setups. These combinations provide structured ways to interpret price action.
Applying these patterns in trading requires context from various timeframes and formations to validate signals. This ensures they align with the overall market direction, thereby increasing reliability. For example, a 2U-2D reversal gains strength in a broadening market, as shown on aligned charts. This offers entry points with defined stops based on pattern extremes. Our funded accounts for futures trading allow traders to act decisively. They can focus on objective criteria to navigate various market conditions effectively.
How can operational tactics reduce human error?
Automating repetitive checks is essential, such as rejecting setups when higher-timeframe alignment is absent. Additionally, logging every rule break with context and reason creates accountability. Over time, this process enables quantification of specific human behaviors that drive the worst drawdowns. Practical proof of this approach comes from implementation outcomes, where the structured application of the method can materially reduce mistakes. A study from the TrendSpider Learning Center suggests that the Strat Trading Strategy can reduce trading errors by up to 30%.
Picture the execution process as similar to maintaining a vintage car. The engine serves as the signal; however, calibration, fuel quality, and routine maintenance ultimately determine whether it actually makes the trip. By keeping the engine tuned, knowing the fuel level, and maintaining a current log, the Strat becomes a practical tool that can be scaled rather than just an occasional miracle.
What hidden limits should traders be aware of?
That straightforward progress feels complete until hidden limits emerge, which often go unmentioned. These constraints can affect trading strategies. Ultimately, they can impact overall performance.
Related Reading
- Basic Trading Strategy
- Spot Algorithmic Trading
- Forex Trading Profit Per Day
- Crypto Trading Bot Strategies
- Best Forex Trading Bots
- Fair Value Gap Trading Strategy
- Best Leading Indicators for Day Trading
- Best Indicators for Swing Trading
- Best Charting Software for Day Trading
- Best Indicators for Options Trading
- Fair Value Gap Trading Strategy
Limitations of the Strat Trading Strategy, and How to Overcome Them

The Strat’s technical rules are only half the battle, and the other half involves systems challenges. Continuous signal monitoring, controlling transaction costs, managing the portfolio, and having a reliable change process are all important for maintaining an advantage. Some solutions include automating detection, making small experiments a regular practice, and setting strict operational limits to prevent human error from eroding this advantage.
Steep Learning Curve for Beginners
The Strat method involves understanding different candle types, complex pattern sequences, and analyzing multiple timeframes. This can seem challenging for people new to trading. This complexity often leads to confusion when interpreting signals in real time, especially without experience with pure price action methods.
To overcome this challenge, it's useful to begin with basic concepts, such as recognizing the three main types of bars, before moving on to more complex patterns and continuity checks. Many successful users recommend focusing on one or two high-probability setups initially. Practicing extensively with historical charts will help, as will gradually improving skills through regular study and simulation.
Time-Intensive Analysis and Patience Required
Using the Strat requires significant screen time. You need to check different timeframes, look for broadening formations, and wait for everything to align on the charts. This can be tough for traders who don’t have much time available. This process can be time-consuming and may result in fewer trading opportunities, which can be frustrating for those who are used to trading frequently.
To address this, focus more on longer timeframes for the overall direction. You can also use tools such as automated indicators or scanners to quickly identify potential setups. Setting up a routine that includes daily reviews and targeting specific, aligned markets can make the process easier while still adhering to the strategy's disciplined approach.
Lack of Guaranteed Success and Need for Complementary Tools
No trading approach, including the Strat, promises consistent wins. Market conditions can create false signals or prolonged losses, even when pattern recognition is strong. Depending only on these patterns might not be enough without looking at the bigger picture, such as support/resistance or volume confirmation. You can improve reliability by combining Strat signals with other technical tools and strict risk rules, such as setting clear stop-loss levels and managing position sizes. Backtesting specific setups and maintaining a trading journal further sharpens your approach, helping turn possible weaknesses into strengths through continuous improvement.
Capital Constraints Limiting Position Size and Risk Management
Individual traders often face limits due to limited personal funds. This situation can make it difficult to expand positions or recover from losses while staying aligned with the strategy's focus on high-confidence, aligned opportunities. These limits may lead to cautious trading or missed chances in fast-moving markets. Leverage prop firm funding as a smart way to access more capital without putting your own money at great risk. Firms provide either simulated or live accounts after evaluation, so you can apply the strategy with the right position sizes. AquaFutures is a leading prop firm in this area, offering good conditions, clear rules, and excellent support for futures traders.
How can you apply the Strat with fewer risks?
Ready to apply the Strat with greater capital flexibility and less personal risk? Explore AquaFutures today to get funded accounts for futures trading that fit perfectly with smart, multi-timeframe strategies. Start your evaluation and improve your trading potential now. Unlock up to 50% off your first funded account, plus surprise BOGO deals and bonuses that change every week.
What operational architecture helps in loss management?
Combine three layers: an automated regime detection system that pauses or tightens entries when volatility or correlation rises; an execution tier that sends orders to lower-cost paths and enforces per-order slippage caps; and a governance layer that logs every rule change with timestamped validations. YieldFund (2025) also reports that the Strat trading strategy has a 15% higher risk of loss than traditional strategies.
This risk can be managed by implementing hard drawdown caps, automated cooldowns, and regular stress testing to prevent a bad streak from becoming a disastrous event. Think of your plan like a dam with three spillways, rather than a single gate; redundancy is what saves the system when the flood comes. Once monitoring, cost controls, and governance are in place, traders can stop guessing and start running controlled experiments. This approach helps them figure out what to scale and when to stop. This solution works until traders notice the one operational habit that most never develop.
Related Reading
- Fibonacci Trading Strategy
- Best Prop Trading Firms
- ORB Trading Strategy
- Crypto Swing Trading Strategy
- Best Copy Trading Platform
- Best Proprietary Trading Firms for Beginners
- Best Stocks for Options Trading
- Silver Bullet Trading Strategy
- The Strat Trading Strategy
- Supply and Demand Trading Strategy
- Profitable Gold Trading Strategy
- Higher High Lower Low Trading Strategy
Unlock up to 50% off Your First Funded Account for Futures Trading
Once you demonstrate your ability with the Strat setups, the next step is to trade them with consistent execution, where it really makes a difference. Think of AquaFutures as a trader-first bridge, like moving from a practice range into a referee-run tournament. This allows you to continue improving your price action, bar-based entries, and higher-timeframe alignment while testing scale under real account rules. You can find more about funded accounts for futures trading and how they can enhance your trading experience.
