


Top 12 Trading Indicators Every Trader Should Know
Trading Indicators offer clear entry, stop, and sizing rules. Discover the top 12 proven tools by AquaFutures to build disciplined, real-capital strategies.
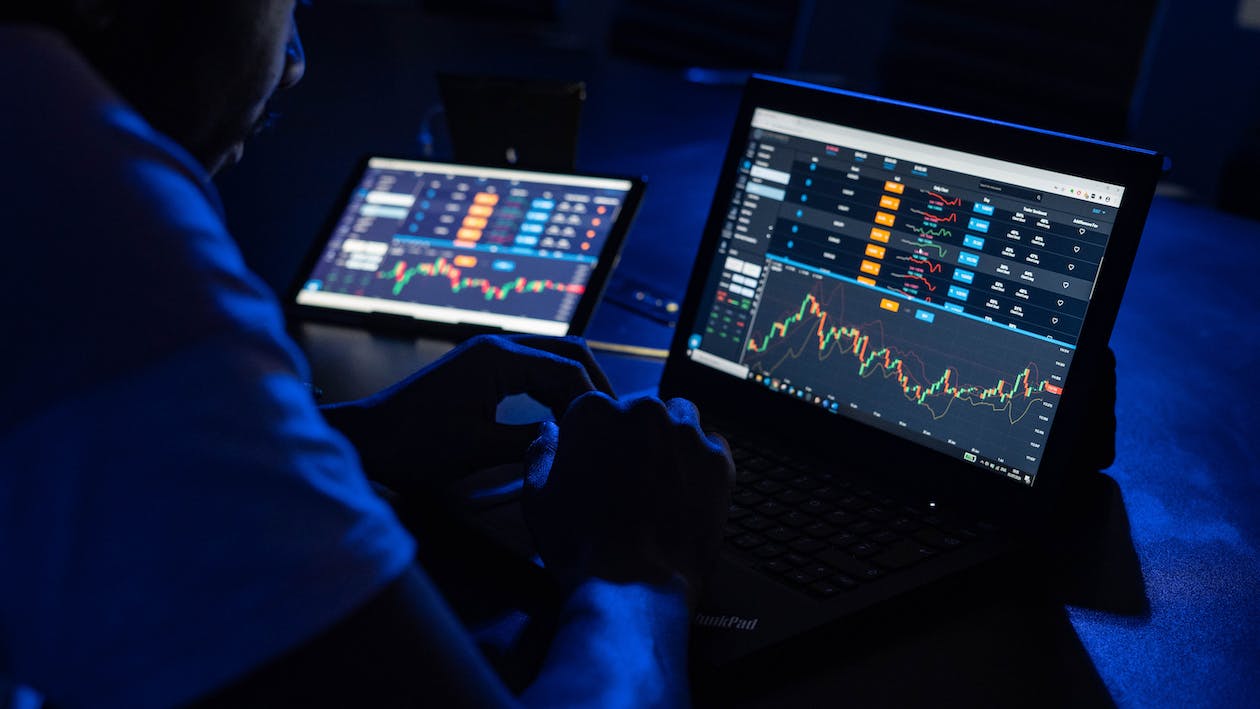
Traders analyze charts to identify setups and interpret signals from various indicators. Trading patterns can emerge from technical measures such as moving averages, RSI, MACD, Bollinger Bands, trend lines, support and resistance, oscillators, and volume, which highlight market momentum and inform entry and exit strategies. Careful evaluation of these signals enhances the ability to spot high-probability opportunities and optimize trade execution.
Consistent success in trading relies on a clear analytical framework and disciplined risk management. Combining indicators effectively supports more informed decisions and a steady trading approach. AquaFutures offers funded accounts for futures trading, providing real capital to test strategies and refine risk management techniques.
Summary
- Trading discipline should start with a simple toolkit: one trend indicator, one momentum oscillator, and one volatility measure, tested for at least a month in live-sim. This setup helps traders aim for modest targets, such as a 6 percent evaluation goal.
- Moving averages are the default trend backbone, used by over 70% of traders, while RSI complements trend filters as a momentum reader in about 60% of strategies.
- Make stops and sizing arithmetic, for example, set stop = 1.5 x ATR, target 2 to 3 x ATR, cut size if ATR doubles, and use tight position sizing such as 0.25 to 0.5 percent equity for mean reversion checks.
- Validation must be honest: run walk-forward tests, Monte Carlo resampling, and out-of-sample checks, and test indicator combinations on at least 50 trades, aiming for 200 or more signals per volatility regime.
- Treat ensembles as calibrated probability machines by converting signals to z-scores or probabilities and weighting by recent out-of-sample performance, a practice aligned with data showing more than 50% of successful traders use combinations of at least three indicators.
- Operational governance prevents decay: track rolling precision using the last 500 signals for high-frequency systems or 50 to 100 trades for lower-frequency setups, lock parameters in a versioned registry, and freeze any signal that exceeds preset precision tolerances.
- Aquafutures's funded accounts for futures trading address this by providing consistent simulated environments with fixed fills, payout rules, and real-account constraints so traders can validate indicators and execution friction before scaling capital.
Top 12 Trading Indicators Every Trader Should Know
These twelve indicators are essential tools that traders use to turn price action into repeatable decisions, not just pretty designs on a chart. When you mix these with a clear trend filter, a momentum measure, a volatility check, and strict position-sizing rules, these indicators go from being personal opinions to risk-managed tools. To enhance your trading strategy, consider using our funded accounts for futures trading to help manage risk and grow your capital successfully.
1. Simple Moving Average (SMA)
The simple moving average helps to smooth out price data. It does this by calculating the average closing price over a set period, such as 50 or 200 days. This method allows traders to minimize distractions and find the main trend direction. If the price is above the SMA, it indicates upward momentum; below it, downward pressure. As a basic lagging tool, the SMA confirms changes without responding to every slight movement. For those exploring options, funded futures trading accounts can enhance your trading experience.
How to use the Simple Moving Average?
To plot an SMA on a chart, use platforms like TradingView or MetaTrader. Watch for price crossovers: enter long trades when the price moves above the line, and short trades when it drops below. Combining short-term (e.g., 20-period) and long-term (e.g., 50-period) SMAs can generate crossover signals. A bullish signal occurs when the shorter SMA crosses above the longer.
2. Exponential Moving Average (EMA)
The Exponential Moving Average (EMA) differs from the Simple Moving Average (SMA) because it places greater weight on recent prices. It places greater weight on recent data points, making the EMA line respond more quickly and track price movements more closely. This helps decrease delays in fast markets. EMAs are especially useful for active trading because when prices are above the line, it indicates bullish control, while prices below it suggest bearish dominance. If you're looking to optimize your strategy, consider utilizing funded accounts for futures trading for better leverage in the market.
How to use the Exponential Moving Average?
Apply a 12-period and 26-period EMA on your chart. Look for bullish crossovers, where the shorter EMA is above the longer one, to start a buy position. Conversely, look for bearish crossovers with the shorter EMA below the longer one to consider selling. Use the EMA as a moving support: buy when prices bounce off it during uptrends or sell when prices reject it in downtrends.
3. Moving Average Convergence Divergence (MACD)
MACD tracks momentum by subtracting a longer EMA (usually 26-period) from a shorter one (12-period). It shows the difference as a line next to a 9-period signal line, and a histogram that shows the gap between them. When histogram bars rise above zero, it shows growing bullish strength. In contrast, bars below zero signal fading momentum or potential reversals.
How to use MACD?
Monitor line crossovers: buy when the MACD crosses above the signal line, and sell when it crosses below. Zero-line crossovers confirm trend changes, indicating an uptrend when above and a downtrend when below. Additionally, spot divergences occur when the price reaches new highs while the MACD does not. This can hint at potential exhaustion.
4. Relative Strength Index (RSI)
The RSI shows how fast prices are moving on a scale from 0 to 100. It compares the average gains to the average losses over 14 time periods. This helps identify areas where prices may be too high or too low. For example, readings above 70 indicate overbought conditions that could lead to pullbacks, while readings below 30 indicate oversold conditions that might bounce back. It's a momentum indicator that is effective at showing when prices reach extreme levels.
How to use the Relative Strength Index?
Add RSI below your price chart. Avoid buying above 70 or selling below 30 on its own; instead, wait for confirmations, such as candlestick reversals. Look for divergences: they're bullish when the price makes lower lows while the RSI is higher, signaling potential upward reversals.
5. Stochastic Oscillator
The Stochastic Oscillator is a momentum indicator that compares the latest closing price to the highest and lowest prices over a specified number of periods, typically 14. This tool produces a %K line and a %D signal line, which is its 3-period simple moving average (SMA). Both lines move between 0-100. This helps identify when an asset is overbought (above 80) or oversold (below 20). This method works for both ranging and trending markets.
How to use the Stochastic Oscillator?
Buy when the %K line crosses above %D and is below 20; sell when it crosses %D and is above 80. In trending markets, ignore extreme readings and focus on pullback entries aligned with the primary trend. Consider adjusting periods for sensitivity: use shorter periods for scalping and longer periods for swings.
6. Bollinger Bands
Bollinger Bands are made up of a middle Simple Moving Average (SMA), usually over 20 periods, and two bands that are two standard deviations above and below it. These bands show how much prices are moving: wide bands indicate high volatility and potential breakouts, while narrow "squeezes" suggest significant price moves ahead. When prices are near the upper band, it may indicate they are too high, while touching the lower band could suggest prices are under pressure to decline.
How to use Bollinger Bands?
To effectively use Bollinger Bands, enter long trades when prices bounce from the lower band during uptrends or when there are breakouts above the upper band. It is advisable to fade extremes in range conditions; sell near the upper band and buy near the lower band. Additionally, monitor for squeezes, where the bands contract, as this is often followed by expansion that offers directional cues, which can be confirmed with volume.
7. Pivot Points
Pivot points show possible support (S1-S5) and resistance (R1-R5) levels based on the previous session's high, low, and close prices. The central pivot (P) serves as the average, indicating a trend bias: if the price is above P, it suggests a bullish trend; if it's below, it suggests a bearish trend. These fixed lines indicate where price action may change direction or break during the day.
How to use Pivot Points?
Traders often notice bounces off support and resistance (S/R) levels. They usually buy at support when prices are rising and sell at resistance when prices are falling. Using breaks across different levels, such as from R1 to R2, can indicate continuation plays. It's essential to reset daily for forex and stocks. Additionally, combining pivot points with candlestick patterns improves entry precision.
8. Fibonacci Retracement
Fibonacci retracement levels (23.6%, 38.2%, 50%, 61.8%, 78.6%) indicate potential pullbacks within prior price movements. These levels come from a mathematical sequence. Markets often pause or change direction at these ratios because of how traders think and act. They don't predict the future, but they identify areas where trends are likely to emerge.
How to use Fibonacci Retracement?
To use Fibonacci retracement, draw the line from the swing low to high during an uptrend or from high to low during a downtrend. Look to buy retracements at the 38.2% to 61.8% levels with bullish confirmation, like pin bars. For profit targets, aim for extensions at 127.2% and 161.8%. Combining these levels with other tools can create stronger setups.
9. Average True Range (ATR)
The Average True Range measures daily volatility by averaging the highest value of current high minus low, high minus previous close, or low minus previous close over 14 periods. This helps determine realistic move sizes for stop-losses, position sizing, and profit targets. When the ATR rises, it indicates that ranges are widening; when it falls, it suggests the market is consolidating.
How to use Average True Range?
Set stops at 1-2x ATR from entry to avoid getting whipsawed. Scale your position size based on ATR, taking smaller positions in high-volatility periods. Aim for profits at 2-3x ATR. Use ATR multiples to trail stops during trends to secure your gains.
10. Average Directional Index (ADX)
ADX measures trend strength on a scale from 0 to 100. It is smoothed over 14 periods and is not direction-dependent. If the reading is above 25, it shows strong trends that are good for riding. If it is below 20, it indicates market conditions that are more favorable for oscillators. ADX uses the +DI and -DI lines to indicate bullish dominance when +DI> -DI and bearish dominance when -DI> +DI.
How to use Average Directional Index?
Traders should enter trends when ADX is above 25. A buy signal occurs when +DI crosses above -DI, while a sell signal happens when it crosses below. It's essential to exit weakening trends when the ADX falls below 20. Also, filter choppy markets by avoiding trades below this level to reduce false signals.
11. Ichimoku Cloud
The Ichimoku Cloud, also known as Ichimoku Kinko Hyo, gives a complete view of trends using five lines: Tenkan-sen (9-period conversion), Kijun-sen (26-period base), Senkou Span A/B (leading spans that create the cloud), and Chikou Span (lagging span). When the price is above the cloud, it indicates a bullish trend; below the cloud, a bearish trend. The cloud's thickness indicates support strength. This all-in-one system is excellent for identifying momentum, support, and resistance levels, as well as future predictions.
How to use Ichimoku Cloud?
Enter a buy position when the price breaks above the cloud. This happens when the Tenkan crosses above the Kijun. On the other hand, sell when the price breaks below the cloud and the crossings are reversed. It's essential to target the cloud's edges, which serve as dynamic support and resistance. To confirm uptrends, ensure the Chikou is above the price. Use thicker clouds as stronger filters for trades.
12. Standard Deviation
Standard deviation measures how much prices vary from the average over a period (typically 20 days). It shows volatility: high values indicate significant price changes and a higher risk of breaks, while low values indicate stable ranges that may revert to the mean. As an essential component of Bollinger Bands, it helps determine whether price movements are unusual relative to recent trends.
How to use Standard Deviation?
Compare the current deviation to historical norms. Enter volatility trades when it spikes, fades extremes, or contracts, and await breakouts. Set dynamic stops at 2 standard deviations from the mean. Pairing with moving averages gives extra context; a high standard deviation in trending markets justifies wider stops.
What should I use to keep things simple and effective?
To keep things simple and effective, choose one trend indicator, one momentum oscillator, and one volatility measure; then stick with them for a month of live-sim testing. Trend tools show direction, oscillators tell when momentum is stretched, and volatility measures help calculate stops and position size. This disciplined approach reduces noise and helps you meet modest targets, such as a 6 percent evaluation goal, while keeping drawdown under control.
Which indicators do most traders actually rely on?
Most traders rely heavily on moving averages to identify trends. This method is the primary basis for trend decisions. Momentum indicators, like the Relative Strength Index (RSI), often work well with moving averages because they show when trends are getting tired and where entry points might be. That's why you see RSI used in many basic trading systems.
How do I combine indicators for short evaluation windows?
To combine indicators for short evaluation windows, favor faster EMAs (12/26) along with the MACD on a 15-minute chart for entries during 1- to 4-week simulated evaluations. Use the Average True Range (ATR) for a stop loss of 1 to 1.5x and set a target of 2 to 3x ATR. For mean-reversion checks in low-volatility sessions, pair Bollinger Bands with RSI divergences, and tighten position size to 0.25-0.5 percent of equity per trade. It is essential to test each combination over at least 50 trades to understand expectancy, drawdown depth, and win rate before risking scaled capital.
When should indicators change how you size or exit?
Indicators should prompt changes to sizing or exit strategies based on market conditions. Use ATR as the baseline for stops and sizing: set the stop at 1.5 times the ATR, and position size as (risk per trade) divided by the stop distance. If the ATR doubles in a single session, cut the size by half and consider signals as high-friction opportunities. To secure gains, trail winners using an EMA or a fixed ATR multiple. This helps avoid turning exits into guesswork. Treat the signal as a high-friction opportunity.
What are standard failure modes, and how do you fix them?
Common failure modes in indicators typically manifest in three predictable ways, each with a solution. First, there are false breakouts during periods of low trading activity, which can be mitigated by increasing volume or seeking confirmation from higher timeframes. Second, indicators can have whipsaw movements when ADX readings are low; in these situations, it's best to switch to oscillators for range trades. Lastly, parameter overfitting can be solved by using out-of-sample tests and walk-forward analysis. It's essential to recognize that each indicator may be vulnerable to regime changes. A simple checklist can help confirm a signal or indicate that it should be ignored.
How do you make indicators serve scaling and payout goals?
To make indicators support scaling and payout goals, convert indicator signals into clear rules linked to payout events. For example, expect a confirmation candle along with a stop based on ATR before increasing size toward a weekly payout. It is also essential to require that a trade never risk more than 0.5 percent of the simulated account during the evaluation phase. These strict rules prevent psychology from overriding a technically valid plan when the temptation to pursue a payout or profit target arises.
Why trust this approach rather than chasing more indicators?
Why trust this approach rather than chasing more indicators? Trust comes from repeatable math and documented outcomes, not from adding complexity. Think of indicators as tools in a cockpit; one tool can fail, but three calibrated tools telling the same story allow you to act confidently. If your backtest shows a steady edge across different timeframes and levels of volatility, you have something worth trading with real capital.
What are Trading Indicators?

Indicators are not magic; they are measurable inputs you can test like any other signal. You should think of them as hypothesis engines that can be proven, disproven, and stress tested. Use them to change uncertainty into repeatable probabilities. Then use those probabilities to size, set acceptance criteria, and define stop rules that hold up under real slippage and rare drawdowns. If you are exploring options, consider our funded accounts for futures trading to get started.
How do I prove an indicator holds up across different market regimes?
To assess whether an indicator performs well across different market conditions, begin with honest out-of-sample testing and avoid merely curve-fitting. Split historical data into contiguous training and test windows, then perform walk-forward validation. This ensures that parameters change only based on historical data, without considering future returns. Measure more than just the win rate; keep track of expectancy, profit factor, worst drawdown, and how long trades last. It is essential to include at least one complete volatility cycle in your test set, ideally spanning several months or years, depending on the contract. Also, use Monte Carlo resampling to see how sensitive your edge is to sequence risk. Record how often a strategy would fail a 6 percent evaluation-type target when looking at random orderings. A slight edge on paper can disappear when trade results are mixed up.
What execution frictions should I model before believing a signal?
Model fills and liquidity are like trading the actual contract at scale, without relying on perfect tick-by-tick fills. Simulate realistic slippage for each contract, gradual fill rates during news events, and the impact of tick size and order type on results. A good indicator is that perfect fills can quickly turn into losses when you consider commissions and missed fills. Track fill delays separately during busy times and slow hours. It’s smart to carefully reduce the observed edge by using the friction factor from those tests rather than guessing a fixed spread.
Most traders validate indicators using spreadsheets and small backtests because they are used to it and it’s fast. While this works for smaller sizes, as traders grow, these small tests can hide compounding errors, inconsistent fill assumptions, and optimism bias. This results in weak rules that may fail in real-world account situations. Platforms like AquaFutures’ funded futures trading accounts provide traders with steady simulated environments and real-account rules. This dramatically reduces validation cycles from weeks to days, revealing execution problems and sizing limits before any money is put at risk.
When does combining indicators actually increase your edge?
Treat ensembles as probabilistic calibrators rather than cosmetic add-ons. Start by creating a confidence score: convert each indicator signal into a standardized z-score or a probability. Then mix them using weighted voting, where the weights are derived from out-of-sample performance rather than intuition, test combinations to see if they improve conditions. For example, assess whether combining two independent signal types improves precision while maintaining an acceptable recall level. Only increase size when you have crossed a confidence threshold. Record PNL by confidence bucket to make sizing predictable; use smaller sizes for low-confidence trades and increase position sizes when the ensemble shows historical robustness.
How do you avoid turning indicators into a psychological crutch?
Set firm rules that separate signal generation from decision execution. Maintain a trade log that records the raw signal, the backtest-derived expectancy for that signal, the modeled friction, and the exact entry and exit rules applied. Review trades weekly for signal slippage and pattern decay. If a signal’s real-world outcome deviates a lot from its historical expectancy after a certain number of trades, suspend it and revalidate with fresh data. Think of this process like tuning a race car. It’s about improving performance, not chasing an imaginary speed boost. Adjusting the setup during a race without data is how risk builds up. Having funded accounts for futures trading can provide the necessary capital to execute these strategies with confidence.
What practical checklist can I add today?
A practical checklist to implement today includes several key steps: calibrate indicator thresholds using percentiles rather than fixed values; always include a friction-adjusted edge estimate; require a minimum number of live-sim trades before increasing size; and log every signal to calculate real-time precision and false-positive rates. These actions transform indicators from mere opinions into reliable metrics that can be effectively scaled with capital.
What happens when you test shortcuts under actual trade conditions?
That promising shortcut may seem safe at first glance. However, testing it under real trading conditions can yield surprising results.
Related Reading
- What Is a Funded Trading Account
- What Is SMT in Trading
- Price Action Trading
- Intraday Trading Tips for Today
- Can Day Trading Be Profitable
- Forex Trading Candlestick Patterns
- Intraday Algorithmic Trading
- Trading Candlestick Patterns
- Volatility Trading
Why Use Trading Indicators?

Indicators make decisions easier to check and repeat. They transform subjective judgment into measurable, testable, and scalable contracts. Indicators can help enforce pre-commitment, reduce cognitive load during live sessions, and define the exact pass/fail checks required by evaluation rules and risk limits.
What does an indicator look like as a decision contract?
When turning a signal into a contract, three essential parts are defined: the trigger, the timeframe, and the execution rule. For example, instead of saying, "buy when momentum looks good," it would be better to say, "enter on the next 1-minute candle if indicator X crosses threshold Y and volume is above the 30-minute median." This small change makes each trade easier to check. It allows us to calculate absolute precision and false-positive rates and stops spontaneous overrides when account balances are tempting.
Why do visualization choices matter for signal quality?
Small UI details significantly affect how you see clean signals. Many chart layouts default to 1340x900 pixels, which affects how overlays, bands, and crossovers align on the screen. This can affect your choice to act or hold back when trading. Think of chart ergonomics as an essential part of your system. Make sure to keep workspace resolution, font sizes, and indicator smoothing consistent across devices so the same signal appears consistently every time.
What subtle errors turn a useful indicator into noise?
A common problem arises from a scale mismatch: settings optimized for a daily dataset will not perform well on a tick chart. At the same time, limits set for low market movements can cause unexpected movements during periods of high volatility. This issue is prevalent among scalpers and swing traders, where execution and indicator calculation windows do not align. The solution is based on constraints: for trades lasting less than five minutes, use less smoothing and test on tick-by-tick fills. For trades held over multiple days, review results across continuous daily sequences and simulate how gaps will open.
How do you know when an indicator is decaying?
Track its accuracy on rolling samples rather than relying solely on total returns. For high-frequency traders, it's essential to watch the last 500 signals. On the other hand, lower-frequency setups should use trade windows of 50 to 100. If accuracy drops below a set threshold, pause parameter changes and run a quick revalidation batch. This process is like regular maintenance on machines, ensuring they work well rather than guessing when something is wrong.
What are the hidden costs of ad hoc validation?
Most traders handle validation with temporary spreadsheets. This approach works at first, but as rules grow, the hidden costs become clear: inconsistent ideas about fills, broken test environments, and an overoptimistic view that ignores sequence risk. Teams find that simulated environments with consistent account rules reduce validation cycles and reveal execution issues early. Platforms like funded futures trading accounts offer standardized simulations that mirror the limits, payout triggers, and fill expectations you will encounter when real money is on the line.
How do indicators protect you from emotional pressure?
Indicators create simple gates to follow when your heart races. Map each indicator reading to a confidence bucket with a historical probability, then size trades based on that probability. When you feel like chasing a one-time pattern, the contract helps you avoid increasing size beyond the agreed confidence band. Remember, risk is not just a theory; it is something you really feel. This serves as a reminder that indicators help manage odds but do not eliminate them.
What does AquaFutures offer to traders?
AquaFutures provides traders with quick, affordable access to funded futures accounts. This service includes instant options, clear rules, and real payouts. If you're looking to speed up validation cycles and grow your capital wisely, there are account options that reward consistent performance.
Related Reading
- Basic Trading Strategy
- Spot Algorithmic Trading
- Forex Trading Profit Per Day
- Crypto Trading Bot Strategies
- Best Forex Trading Bots
- Fair Value Gap Trading Strategy
- Best Leading Indicators for Day Trading
- Best Indicators for Swing Trading
- Best Charting Software for Day Trading
- Best Indicators for Options Trading
Leading vs. Lagging Indicators
Leading indicators provide early warnings, but at the cost of more false alarms. In contrast, lagging indicators provide more apparent confirmation after the move, but you have to contend with late entries. Use leading indicators to select entry size and timing, and use lagging indicators to protect winning trades and scale up with confidence.
When should you act on a leading signal?
Leading reads are best when you want to be early, and your risk per trade is negligible. Early entry can yield profits, but it also increases the risk of false positives. In practice, it is a good idea to wait for at least one small confirmation, such as a short-volume threshold or a second independent oscillator reading, before committing significant capital to the trade. This helps reduce the emotional pressure that can lead traders to chase opportunities every day, turning careful plans into overtrading and reducing accuracy.
How do lagging tools help in holding and scaling?
Lagging tools are effective at preserving gains and preventing whipsaws when a clear trend is present. They exchange speed for dependability. Use them to set scaling rules and stop placement, and to decide when to let a trend manager take over a position rather than make impulsive decisions.
Which performance metrics should you track?
Treat each indicator like a KPI. Track them with rolling precision, a low false-positive rate, and realized expectancy instead of relying on personal opinion. According to BMC Blogs, 70% of organizations use KPIs to track performance, and measurement is now an operational norm. This makes it essential to include your key performance indicators in regular reviews. Tracking these stats in short, consistent time frames helps you notice decay before it costs real money.
What failure modes deserve the most attention?
Three standard failure modes warrant attention: parameter mismatch, which occurs when market volatility changes; crowding, when popular parameters lose effectiveness; and sequence risk, when winning and losing trades arise together. When any of these problems occur, it is essential to stop adjusting parameters, test with a new out-of-sample window, and consider retiring the indicator until it has been validated again. This pattern is typical in simulation accounts and live trading; the primary reason is the unchecked belief that past calibrations still work in current market conditions.
How does fragmentation affect trading validation?
Most teams handle validation in fragmented spreadsheets because this method is familiar and quick. While it works well at a small scale, fragmentation can obscure execution assumptions and reveal issues with the order of operations. Solutions like platforms that offer instant simulated funding and consistent account rules create a single, repeatable environment for traders. This allows for fixed fills and payout rules, enabling ensembles to be tested against the real challenges that arise as capital scales.
How should you combine them without creating noise?
Leading signals are pings, while lagging signals show the wake left behind. Each type tells us something different. To use them together well, turn these signals into probability scores. Give them importance based on how they performed recently outside of usual tests. Also, consider increasing the size only when the combined signals meet a calibrated confidence threshold. This approach aligns with the strategies used by successful teams across many areas. It also aligns with BMC Blogs, which notes that 85% of successful companies use a mix of leading and lagging indicators. Using these indicators together helps with both early capture and durable confirmation.
What practical tests can you apply to indicators?
You can argue about technical merit, but the real test is how well it works in practice. Start with small, measurable bets and keep a record of the results to make sure your indicators can do well in a steady simulated account before you increase the size. This method shows the big difference between prediction and performance.
What is the real choice between early signals and confirmation?
The surprising part is that what appears to be an either-or choice between early signals and solid confirmation actually obscures the key trade decision. This decision will affect whether you keep trading at scale.
How To Choose The Right Trading Indicator

Choose indicators like you pick tools for a job: based on what they can reliably measure, how well they work with your trading, and whether their claims about probability hold up under honest testing with the exact rules you will follow. Focus on calibration and governance instead of prestige, and test every candidate with the same careful analysis before you risk larger amounts of money or capital.
What does calibrated mean in practice?
Think of every indicator as a probability estimator, not just a simple yes or no. Change signals into a predicted chance of profit for the next trading period. Then, check calibration using reliability plots and a Brier score on at least 200 signals for each volatility level. This method helps you see not only how often it wins but also how well its confidence aligns with reality. For example, if a signal keeps saying there is a 70 percent chance of success but only wins 40 percent of the time, you do not have an advantage; instead, you have overconfidence. In this situation, you need to either adjust the thresholds or reduce the size until calibration improves.
How should I normalize signals across instruments and timeframes?
To normalize signals across instruments and timeframes, standardize each indicator to a z-score or percentile. This should be calculated using rolling, regime-aware windows. This method ensures that a crossover on one contract has the same statistical importance as another. Using percentiles to set thresholds, rather than fixed numbers, preserves signal meaning by adjusting to recent volatility. This approach effectively stops the silent failure that can happen when a fixed threshold works for one contract but causes whipsaws on another.
How do you manage changes without breaking live performance?
To manage changes effectively without impacting live performance, lock parameters in a versioned registry and require an experiment plan before any changes. This plan should include an out-of-sample test, a fixed sample size for live-sim A/B testing, and an alpha-spending rule to prevent false positives from occurring when testing multiple times. When a new parameter set outperforms the baseline in simulation, stage it to a small live allocation for a fixed number of trades. Monitor trade-level expectancy and execution friction closely, and implement changes gradually only if results remain consistent.
Why does execution risk rewrite an indicator’s edge?
Execution risk can significantly affect an indicator's effectiveness. Latency, queueing, and pricing all affect how proper a signal is. If a model expects to receive fills in under 1 second but the edge disappears at 200 milliseconds, the math is incorrect. Make sure to model slippage in backtests; include how different order types affect results, and treat execution behavior as part of the indicator. Think of it like placing a sensor: the same instrument placed in another location gives a different reading.
What is a practical ensemble discipline?
A practical ensemble discipline combines multiple signals to improve decision-making. Each signal is converted into a probability, which is then combined using a weighted method; the weights are derived from recent performance data rather than guesswork. This method uses a decision rule that links ensemble size to confidence level. This connection is limited by worst-case tests, such as capping growth to a fractional Kelly criterion and setting a strict drawdown ceiling. These precautions prevent excessive growth when a temporary statistical anomaly appears favorable.
How to govern, log, and audit effectively?
Effective governance, logging, and auditing are critical. Build a signal registry that tracks version details, parameter changes, test windows, and friction assumptions. Require a one-page trade ticket template that connects a live trade back to the signal version. To ensure accountability, schedule quarterly audits to verify calibration, precision by bucket, and outcome distribution. Automatically retire a signal if its precision falls below a defined tolerance for a specified number of consecutive months. This method focuses on a predictable process rather than heroic improvisation, enabling sustainable scaling.
When should you terminate a signal?
When should you stop using a signal? If out-of-sample expectancy changes sign after realistic friction modeling, or if the indicator's setup degrades across two different volatility regimes, even after careful adjustments, you should stop using it. A retired signal is data, not a failure. Archive it, document what went wrong, and use that information to improve your next parameter search. This method helps you learn faster and prevents you from repeating the same mistakes, especially when evaluating funded accounts for futures trading to enhance your trading strategy.
What is a non-technical analogy for indicators?
Think of your indicator suite as a ship’s navigation panel: it includes a compass, a speedometer, and a depth sounder. If one device drifts, the others can help you for a while. However, if all three slowly go out of line at the same time, you will run aground. To stay safe when the weather gets bad, it’s essential to check your equipment regularly, have backups, and prepare a short emergency checklist.
Why is calibration crucial for indicators?
Indicators are commonplace and often used together, creating crowding and parameter convergence that reduce simple edges. This everyday use underscores the need for careful calibration, probability-based grouping, and effective governance, rather than simply adding another layer to your chart.
How to test your indicators?
Finally, test your indicators to assess both accuracy and cost. The best systems handle friction and growth; this quality is often found in top performers who use teams rather than a single approach.
What happens when incentives shift?
That system works until incentives change, leading to a review of how and when to grow.
Unlock Up to 50% Off Your First Funded Account for Futures Trading
Traders focus on tuning indicators and signals to ensure that their entries, stops, and position sizing perform well under pressure, as they do in a clean backtest. When evaluation timers and payout rules start to test that discipline, platforms like AquaFutures offer clear funded accounts with trader-first economics. They also provide quick support, real payouts of up to $450K, and limited-time discounts. This helps you turn consistent momentum and volatility rules into funded capital without extra friction. Check out funded accounts for futures trading.
Related Reading
- Fibonacci Trading Strategy
- Best Prop Trading Firms
- ORB Trading Strategy
- Crypto Swing Trading Strategy
- Best Copy Trading Platform
- Best Proprietary Trading Firms for Beginners
- Best Stocks for Options Trading
- Silver Bullet Trading Strategy
- Order Block Trading Strategy
- The Strat Trading Strategy
- Supply and Demand Trading Strategy
- Profitable Gold Trading Strategy
- Higher High Lower Low Trading Strategy
