


What Is SMT Divergence in Trading, and How Do Traders Use It?
What Is SMT in Trading? Learn how SMT divergence exposes market shifts and improves trade accuracy. AquaFutures’ funded accounts let you test fundamental strategies.
.webp)
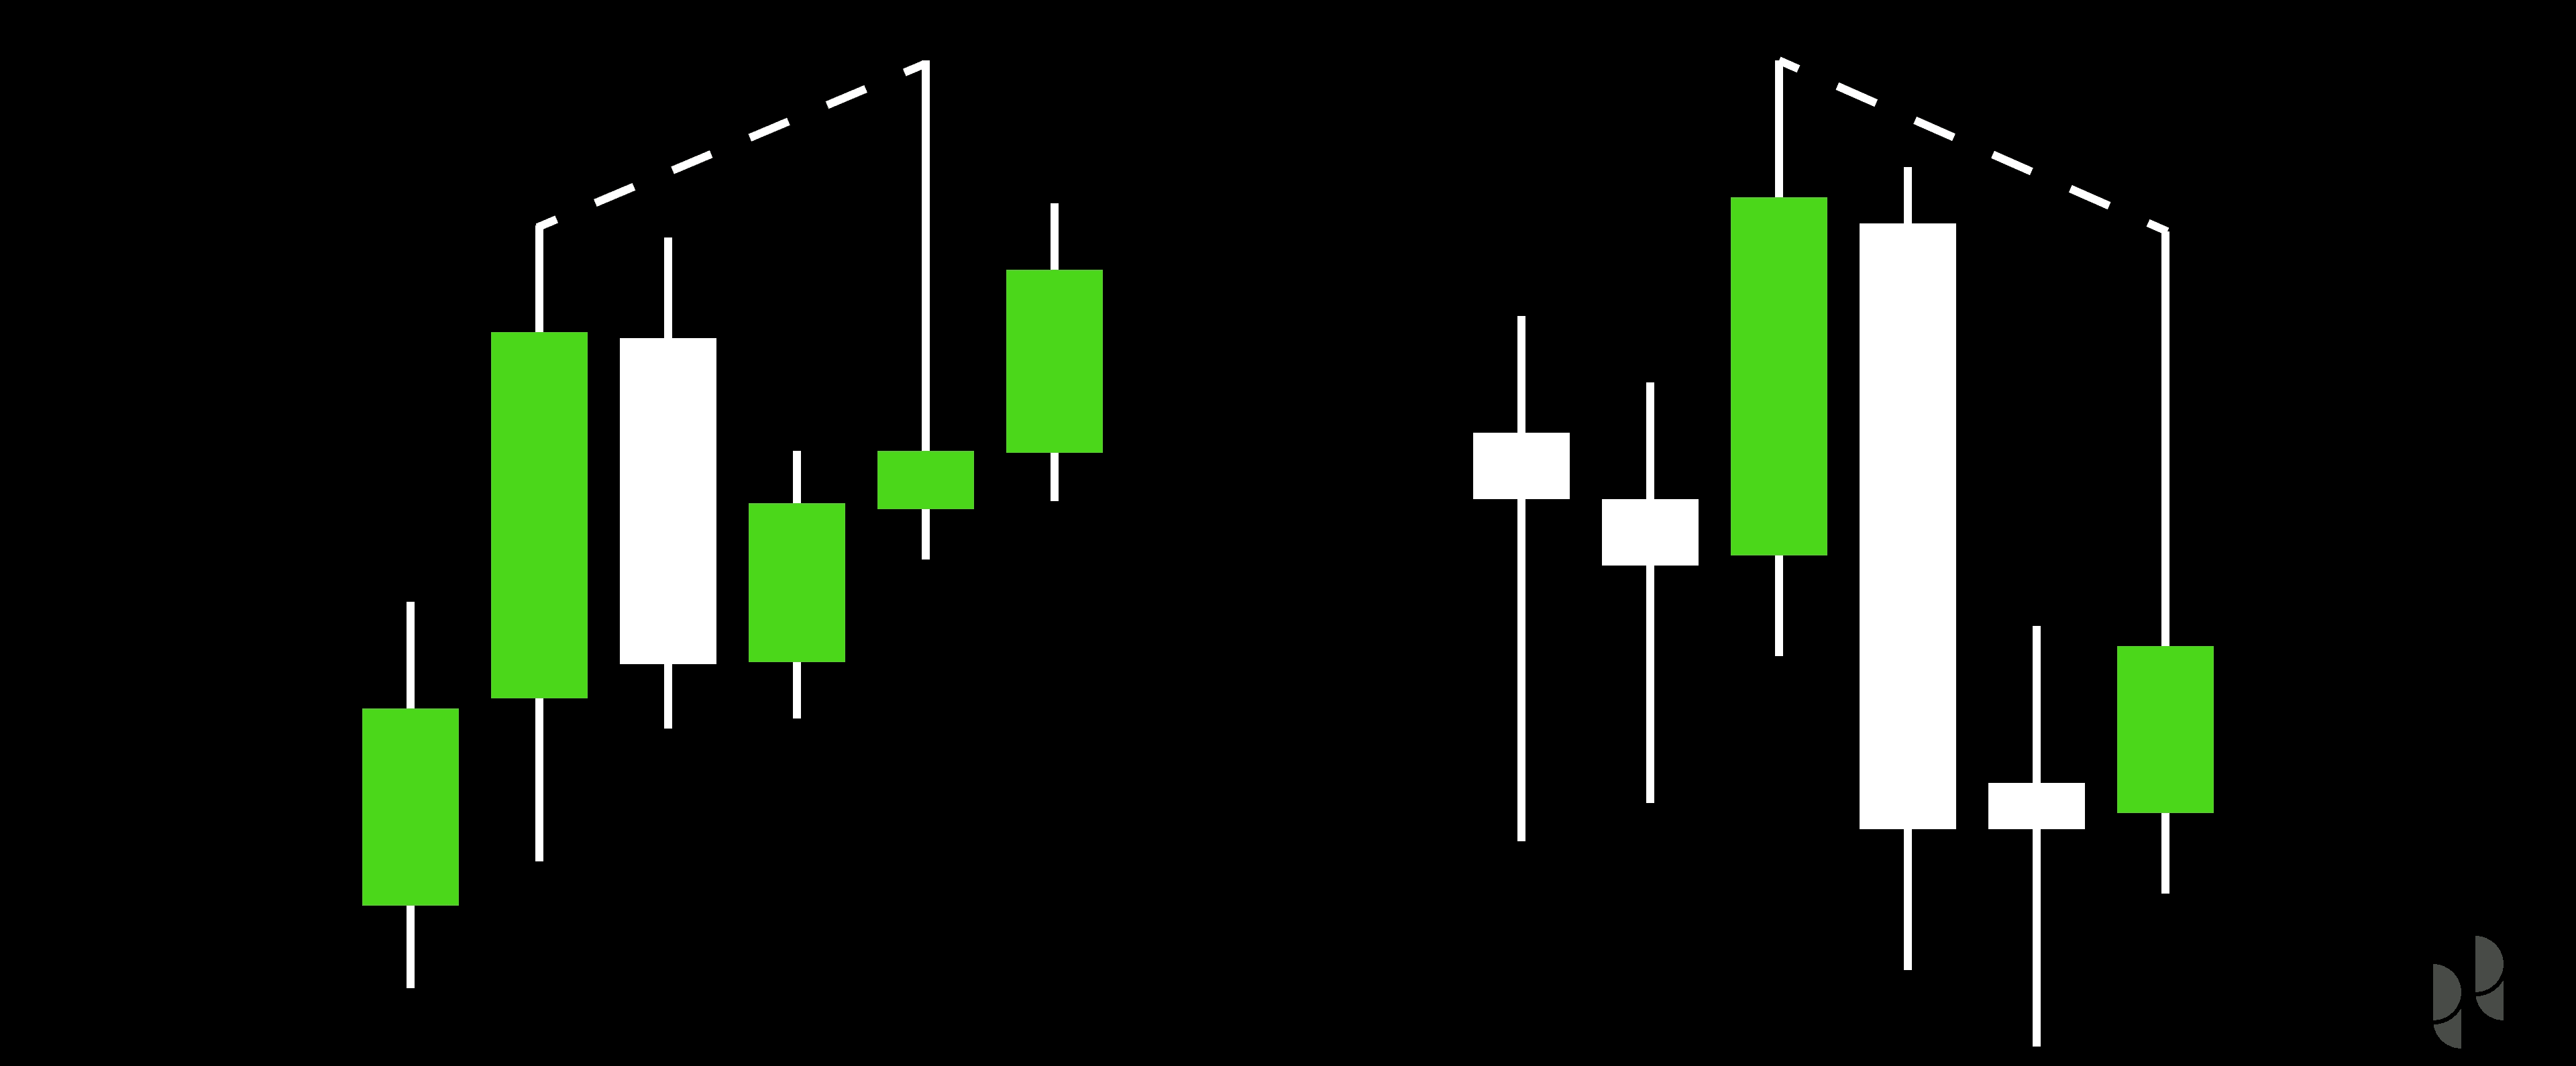
Watching a chart can be frustrating when a sharp reversal appears just after a trade is closed. SMT divergence uncovers subtle clues in price action, order flow, and even Trading Patterns, offering a window into institutional moves and early signs of market shifts. It clarifies the relationship between related markets and highlights discrepancies in liquidity pools, enabling a more confident trading approach.
A deeper understanding of these dynamics helps traders align their strategies with institutional rhythms and spot potential reversals sooner. AquaFutures supports this analytical journey by offering funded accounts for futures trading, providing real capital to practice and refine these skills efficiently.
Summary
- SMT divergence is primarily used as a confirmation layer, not a trigger. 75% of traders use it as a key indicator, which explains its frequent pairing with liquidity maps, order blocks, and volume profiles.
- When combined with disciplined trade management, SMT divergence has been associated with a roughly 20% increase in trading accuracy, reframing the tool as an improvement to signal-to-noise rather than a guarantee of wins.
- About 50% of successful trades involve SMT divergence analysis, indicating that verification and execution rules matter more than the initial detection of a mismatch.
- Reliability depends on market microstructure: 80% of traders report improved accuracy when deep liquidity and narrow spreads exist, and studies link disciplined execution to a 25% increase in profitability.
- Make divergence repeatable through rigorous validation: backtest across a rolling 6- to 12-month window, require two independent market internals, and wait 30 to 50 verified occurrences before scaling capital.
- Fix operational leakage and model drift with a disciplined process, for example, a structured 60-day practice that enforces checklists, and research showing up to a 30% accuracy gain when operational issues are addressed.
- Aquafutures's funded futures-trading accounts address this by allowing traders to run live-style capital with instant funding and fast payouts, thereby compressing iteration cycles and validating SMT-based tactics under real execution and risk constraints.
What is SMT Divergence in Trading?

SMT divergence is a valuable signal that helps traders confirm their trades by showing when related instruments stop agreeing. Using it correctly improves timing and reduces surprises. However, it requires context, patience, and a way of working that aligns with how large institutions think. For those looking to enhance their trading experience, consider exploring our funded accounts for futures trading to support your strategies.
How do traders actually use SMT divergence every day?
In busy trading environments, traders see SMT as a confirmation tool, not a trigger. Use SMT Divergence as a key indicator alongside liquidity maps, order blocks, and volume profiles, rather than on its own. In practice, traders will do this in two ways: first, by using divergence to avoid entering faded momentum; second, by being more careful with their position sizes when one instrument is behind its peers. This small change in how they act, from responding only to price changes to also considering cross-market confirmation, helps reduce emotional volatility.
What goes wrong when traders misread divergence?
When traders misread divergence, they often fall into the trap of overconfidence. They see a mismatch as proof of a market reversal that never happens. It can be tiring when a signal appears clear on charts, only to see the market move because of liquidity shifts or news events. The real cost comes from many false starts that harm both capital and confidence. This harmful pattern is typical among FX and index traders. Without setting clear rules about which instruments to use, which timeframes matter, and how to weigh volume and liquidity, divergence can just be noise. A safer strategy needs at least two supporting market internals before changing exposure. It’s also important to size trades to make sure that a single false divergence does not eliminate one's trading advantage.
Why do experienced traders lean on SMT?
Experienced traders use SMT to see institutional footprints that retail setups often overlook. Many traders use SMT analysis in various ways because it appears realistic and cost-effective. However, as they grow, this method creates friction: split simulations, inconsistent sizing, and slow feedback loops can change promising setups into missed chances. This is where exploring funded futures trading accounts can make a significant difference by providing access to better resources and tools.
How do platforms like AquaFutures support traders?
Platforms like AquaFutures provide traders with a better trading experience. They offer instant funding, live-style capital, and up to 100% profit splits through programs like up to 100% profit splits. There are also no activation fees, quick weekly payouts, and round-the-clock support. This setup allows traders to test SMT-based strategies under real-time pressure without risking their own capital or waiting long to grow their trading. As a result, traders find that accelerating iteration cycles helps them learn faster while still keeping risk under control.
When should you trust a divergence signal?
Trust grows from pattern, not hope. It needs correlated confirmation across different instruments. This means ensuring liquidity zones align with the divergence across multiple timeframes. This method stops a short-term separation from being perceived as a long-term issue. To explain: divergence is like seeing a faint bootprint next to a well-used road; it shows that someone moved differently. But you still need to follow the trail to see where they went. Emotionally, this is comforting; retail traders often report feeling supported by the clarity SMT provides. However, they remain cautious because it takes practice to read the footprints correctly. This tension can be helpful when your process follows simple rules: divergences require action, while others are just monitored.
What is more to learn about identifying reliable divergence?
Identifying reliable divergence setups takes more understanding than what most guides explain, and the next section will show you why.
Related Reading
- What Is a Funded Trading Account
- Price Action Trading
- Intraday Trading Tips for Today
- Can Day Trading Be Profitable
- Trading Indicators
- Forex Trading Candlestick Patterns
- Intraday Algorithmic Trading
- Trading Candlestick Patterns
- Volatility Trading
How to Identify an SMT Divergence

You can identify reliable SMT divergence by analyzing market behavior like a detective. First, find the clear structural mismatch, then look for market details that show intent. It’s essential to search for consistent, repeatable patterns across different timeframes and instruments, instead of just one-time oddities. Only take action when multiple independent confirmations align, and consider using funded accounts for futures trading to enhance your trading strategy.
What timeframes and pair selection actually matter?
Scan a tight set of related instruments across two complementary timeframes, for example, a 5 to 15-minute chart for entries and a 1-hour chart for context. The main pattern to look for is when one instrument makes a new low or high while its pair does not, and that difference sits at a clear support or resistance zone. Choose pairs that share common influences, then reduce distractions by limiting your watchlist to three to five logical combinations so you can focus on the structure without feeling overwhelmed.
How do you separate noise from institutional intent?
Separating noise from institutional intent means examining how volume behaves and how prices react as key indicators. If a divergence happens with low volume and quick, one-bar reversals, it is likely just retail noise. On the other hand, if a divergence appears with absorption candles, trapped-liquidity wicks, or a clear liquidity sweep followed by a hold, it suggests institutional behavior. Think of it like listening to two musicians: one stays perfectly on beat while the other falls out of sync. If the drummer changes his rhythm and the rest of the band follows him, that shows intent.
Which market internals should you require before taking the trade?
Before taking a trade, two independent market internals beyond price structure are essential: volume profile alignment and order flow imbalance, or a confirmed structure break on a higher timeframe. For order flow, look for matching prints at the level where the divergence ended. Regarding the volume profile, ensure that the point of control or a value area boundary aligns with the divergence low or high. If none of these factors align, the signal should be moved to the watchlist instead of the blotter.
How should you size, enter, and protect a trade-off divergence?
To appropriately size, enter, and protect a trade‐off divergence, use graded exposure. Start with a cautious initial size, then think about adding to the position only after a clear retest or when you see institutional footprints. Place your stops outside the nearest higher-timeframe structure rather than on a tight technical wick. It's important to size your trades so that one failure does not end your participation. A good rule is to commit no more than a part of your allowable risk on the first leg, keeping some capital for a possible second entry if the market shows that the setup is valid.
What validation steps make this repeatable rather than anecdotal?
What validation steps make this repeatable rather than relying on personal stories? Backtest your exact pair, timeframe, and entry rules over a rolling 6- to 12-month period. Log your win rate, average return, and drawdown based on each setup type. Keep track of how many trades you label as 'verified' after you see order flow confirmation compared to those you only observed; that ratio can be a helpful personal metric for your discipline. Also, maintain a short notes log for each trade that explains which internals confirmed the divergence. This way, pattern recognition trains on truth, not just hope.
What common mistakes degrade reliability?
A few common problems stand out: using different timeframes, treating one tool as the best without checking which is actually leading, and mixing up temporary differences during news events with fundamental divergence. Newer traders often focus too much on indicator readings rather than on price structure and market internals, which can create false confidence. Learning this by random trial and error can be tiring. Instead, running focused demo runs with careful logging can help address these problems more quickly.
How do you translate confusion into consistent skill?
When AquaFutures created 60-day guided demo programs, traders significantly reduced chart-marking errors. They did this by following a checklist that included selecting pairs, aligning timeframes, obtaining two internal confirmations, and developing a written entry plan. This type of practice helps turn occasional insights into muscle memory. In addition, it allows traders to test SMT setups without risking real money until they confirm the pattern can be repeated.
What practical reminder from the field?
A practical reminder from the field is that around half of successful trades involve SMT divergence analysis. This shows that disciplined verification is more important than just noticing it at first. Furthermore, the everyday use of toolkits is shown in the adoption data. The real advantage comes not just from knowing the idea but also from reliably executing it.
What is the next obstacle?
The next obstacle is more complex than the charts themselves. It forces traders to pick between promising patterns and repeatable rules.
What is waiting in the next section?
The real challenge is coming up in the next section.
Does SMT Work In All Financial Markets?
SMT can work across many financial markets, but it does not work the same in all of them. It performs best in situations with tight, repeatable relationships and deep liquidity, which allow one instrument to act like another. On the other hand, it struggles when correlations break down or when execution frictions arise.
1. How does SMT perform in forex markets?
SMT performs well in forex, where pairs like EUR/USD and GBP/USD often move in tandem because similar factors, such as dollar strength, influence them. When one pair reaches a new high while the other stops, this divergence often indicates that smart money is preparing for reversals or seeking liquidity. Traders check historical correlations to confirm these signals before taking action.
What about equity indices and SMT?
Equity indices like the S&P 500 and Nasdaq 100 often move together because they track similar stocks and reflect broader market sentiment. This makes SMT helpful for finding differences. If one index hits new highs while the other is held back, it could show uneven trading by big players or upcoming changes. However, fast-paced trading can disrupt these patterns, so it’s essential to look for additional evidence in volume data.
3. Can SMT be applied to bond markets?
Bond yields often relate to currency pairs based on expected interest rates. This lets SMT show unusual splits. When U.S. Treasury yields rise, this usually puts downward pressure on pairs like EUR/USD. However, if this does not happen, it can indicate changes in the economic outlook or hints of policy changes. This is most effective during times when rates are sensitive, but low liquidity in some bonds can weaken the signals.
4. How does SMT relate to commodities?
Commodities such as oil and gold are often linked to related stocks or indices, particularly in the energy sector. This connection helps SMT find differences in positioning. For example, if oil prices rise while the energy index remains unchanged, it may indicate inefficiencies or targeted buying. However, external factors, such as geopolitical issues, can disrupt these differences, making the market less consistent.
5. What market traits matter for SMT reliability?
What market traits actually matter for reliability? Key factors include liquidity depth, spread behavior, and the concentration of institutional activity. These factors determine whether SMT signals are effective in real-world situations. Markets with narrow spreads and consistent order flow make it easier to spot minor, persistent mismatches. On the other hand, thin markets create one-time oddities that seem like signals but are really just noise.
6. How do regime changes affect SMT?
How do regime changes and calendar cycles break the edge? Correlations can decay during monetary policy shifts, earnings seasons, or sudden geopolitical moves. This decay is predictable if you watch for it. Treat regime change as a binary constraint: either your historical window includes similar shocks, or it does not. It's essential to roll-test your setups across at least two distinct regimes and keep a log of how many divergences failed during high-volatility weeks. Expect model drift; your rules must be revalidated quarterly, not annually. Traders often get frustrated when clean setups collapse into noise after a shock. This exhaustion can cost as much as any false signal.
Why is testing important for SMT?
Most teams rely on backtests done on fixed samples because this method is familiar and cheap. While this approach can work at first, as you grow, you see hidden costs: data bias creeps in, feedback slows, and real-world results often diverge. Platforms like funded accounts for futures trading shorten this loop by allowing traders to use live-style capital, ensuring quick funding and fast payouts. This allows for checking and changing behaviors under real-world pressure, rather than relying solely on historical data.
What changes in execution and risk controls by the market?
Adjust position sizing based on realized slippage and fill rates, rather than theoretical spreads. Use adaptive stop placement linked to a higher timeframe structure and expected operational cost. It's essential to measure post-trade metrics weekly, like average slippage, fill ratio, and trade duration. Adding SMT divergence provides context on what disciplined execution and effective risk management can accomplish when the method is used with these controls.
How should traders approach SMT calibration?
Think of SMT as a seismic sensor: it detects institutional tremors but requires calibration based on market conditions, time, and execution. This calibration is where disciplined testers stand out from hopeful hobbyists. It's also why patterns can feel strong yet fragile when key verification steps are ignored.
What opportunities does AquaFutures provide?
AquaFutures gives traders fast, affordable access to funded accounts for futures trading with instant options, simple rules, and honest payouts. Traders can compress learning cycles or validate SMT tactics under live-style conditions. AquaFutures programs are designed to reward consistent performance through transparent rules and rapid payouts.
What happens when you test improvements?
That simple improvement may seem convincing at first. However, testing it during a real volatility cycle can show results that require a different set of rules.
Related Reading
- Basic Trading Strategy
- Spot Algorithmic Trading
- Forex Trading Profit Per Day
- Crypto Trading Bot Strategies
- Best Forex Trading Bots
- Fair Value Gap Trading Strategy
- Best Leading Indicators for Day Trading
- Best Indicators for Swing Trading
- Best Charting Software for Day Trading
- Best Indicators for Options Trading
How to Trade SMT Divergences

Trade SMT divergences by turning them into objective rules that you can test and repeat. This is better than relying on your gut feelings. Define clear triggers for when a divergence is ready to trade. Write down sizing and confirmation steps, and treat every trade as data to improve your ruleset. What exact signal changes a divergence from something you observe to something you trade? Make the trigger based on numbers. You need the price difference between the two paired instruments to go beyond a statistical threshold for at least two different observation periods. Then, check that the divergence continues in volume behavior. Moreover, when considering funded accounts for futures trading, it's beneficial to know that our platform can provide options tailored to your trading strategy.
How should you size entries and scale into a validated setup?
Start with a size that matches your measured edge, not just a guess. Get a baseline edge from an out-of-sample backtest and turn it into a fractional Kelly allocation, limited by your maximum risk per trade. Do this in two steps, with the first step being about 30 to 40 percent of your target exposure. You should only add the rest after explicit confirmation, such as a clean retest within your trade window or another volume-based print. Use ATR-based stops, such as 1.5 to 2 times the 20-period ATR, to keep risk consistent across different situations and avoid small stops from hurting your overall results.
How do you keep SMT from becoming an excuse to overtrade?
Discipline is the hard edge of this method. This pattern appears across discretionary retail and funded-sim environments: traders often force entries at every hint of divergence, which burns mental capital. This issue can be addressed by implementing session filters, setting a daily hard trade-frequency cap, and using an entry checklist that must be completed before placing an order. When traders I work with adopt a three-item checklist, they stop entering early and focus on high-quality setups. This approach reduces the emotional urge to chase trades and enhances execution focus.
What concrete metrics should you log after every divergence trade?
Track the instrument pair, the timestamp of when you notice a divergence, the spread z-score when the trigger happens, the time that has passed from divergence to entry, the first-fill slippage, fills by leg, realized risk-to-reward ratio, and the outcome by leg. Capture rolling aggregates every 50 trades, including win rate, average win, average loss, expectancy, max drawdown, and fill ratio. Use a control chart for expectancy to spot changes in the trading environment. This data helps turn stories into informed decisions and shows when the method needs retuning, instead of just hoping for the best.
How do you validate the edge statistically, not just visually?
Use rolling walk-forward tests and bootstrap outcomes to estimate the variance of your expectancy. First, run a simple null hypothesis test that compares divergence trades to a non-divergence baseline. It's essential to ensure the out-of-sample edge survives at a low p-value before scaling up your capital. Additionally, simulate execution by adjusting fills for any observed slippage. A positive backtest that assumes perfect fills may not hold up in live conditions. Therefore, treat statistical validation as a gating mechanism, not just a one-time checkbox.
Can automation or alerts reduce missed opportunities without killing discipline?
Yes, but only if alerts follow your trade rules. It's essential to create an automated monitor that checks the pair spread and triggers a signal when your z-score and persistence criteria are met. Send alerts to a filtered channel, ensuring the correct checklist state is included with each alert. The goal of automation should be to reduce screen time, not to enable impulsive trading. Think of the alert system as a trusted suggestion, not an obligation to trade.
How can traders manage iteration effectively?
Most traders manage iteration with ad hoc spreadsheets and scattered demo runs because these methods are familiar and initially work well. However, the hidden cost is fragmentation, which leads to inconsistent sizing, slow feedback, and uneven record keeping. This fragmentation can stretch learning from months to years. Platforms like AquaFutures provide traders with access to live-style simulated funding of up to 450K, quick payouts, and ongoing support. These features can significantly shorten iteration cycles, helping traders to validate SMT rules under consistent, rule-based capital conditions.
What practical habit pays off fast?
Establish a weekly routine: choose one pair combo, carry out five divergence-trade occurrences using your checklist, and write down the results in your control chart. Only go to the next step after you have 30 to 50 verified instances. Think of each step as a hypothesis test that you must either prove wrong or confirm.
How should you approach SMT testing?
Think of SMT testing like tightening a camera lens, making small changes one at a time. If you move too fast, you might miss the focus. But if you move too slowly, it can cause motion blurring in the picture.
What complicates the SMT process for traders?
The part that most traders do not expect makes everything following it more difficult.
Limitations of Using SMT Divergence and How to Overcome Them
SMT divergence presents challenges that become apparent after the first few live trades. Most of these problems can be addressed through improved data management, realistic execution tests, and automated drift detection. Start by ensuring everything is working correctly and validating the data; then refine alerts and sizing so the signal becomes consistent and repeatable rather than only sometimes convincing.
What kinds of operational errors can look like strategy failure?
Timestamp mismatches, differing aggregation time frames, and different exchange feeds can create phantom divergences that never existed for a single liquidity provider. You can fix this by aligning raw tick feeds to a single standard clock, rebuilding bars from ticks rather than relying on vendor-aggregated candles, and normalizing for roll and session gaps. Try a short experiment: replay ten days of tick data for your pair and compare the synthetic spread behavior at the tick level with that of minute bars. You will see which signals disappear when you remove aggregation artifacts.
How do you validate robustness without overfitting to past noise?
Treat parameter tuning as a falsification exercise instead of just optimization. Use out-of-sample blocks that cover at least two primary market conditions. Also, randomize trade start points during bootstrapping. Moreover, verify that the parameters remain stable across multiple holdout sets before scaling up. Introduce a minimum-event rule: for a parameter set to be ready for live trading, it must show a consistent edge across N independent divergence occurrences. Logging parameter drift is essential to enable quick adjustments as market conditions shift.
What execution and market-microstructure costs should you model?
Slippage and fill probability aren't constant; they vary by time of day, order type, and depth imbalance. Creating a simple order-book replay can help you estimate realistic fills and plan for the worst-case scenarios during the first part of a staged entry. Keep track of realized slippage as part of the current ATR, and adjust your sizing so that a 2x-worse-than-historical fill still meets your risk tolerance. Think of execution as a limit on expectancy, not just something to consider later.
How do you detect when a divergence signal is decaying?
Instrument the signal with distributional monitors, not just trade counters. Calculate rolling Kullback-Leibler divergence or Jensen-Shannon distance between the current spread distributions and the baseline. Raise a pause flag when the distance goes over a set threshold for T consecutive sessions. Use this method alongside a control chart for win rate and average slippage. Automatically reduce size or stop alerts when control limits are crossed, helping you avoid trading broken edges before incurring losses.
What small habits deliver outsized reliability gains?
Standardizing data ingestion requires tick-level replay when adding new pairs. It's also essential to attach a one-line trigger snapshot to every trade note; this snapshot should include ambient volatility, feed source, and the execution model used. You can think of it like adjusting an antenna: even small changes can significantly lessen static. A more transparent process, with strict artifact logging, accelerates debugging. This change turns noisy luck into a way to recognize patterns, helping people change occasional wins into a true edge.
What is the next problem traders should notice?
The next problem is one that traders rarely notice until it costs them money. This issue fundamentally changes how they should think about scaling.
Unlock up to 50% off Your First Funded Account for Futures Trading.
You’ve tested SMT setups, logged divergence signals, and felt how execution limits and capital rules can reduce otherwise repeatable edges. AquaFutures offers you a practical way to go from simulated trading to live-style funded futures accounts so that you can validate those patterns under clear rules, collect real payouts, and scale when your edge holds. You can also get up to 50% off your first funded account and rotating BOGO bonuses to help you get started. Check out the funded accounts for futures trading to learn more.
Related Reading
- Fibonacci Trading Strategy
- Best Prop Trading Firms
- ORB Trading Strategy
- Crypto Swing Trading Strategy
- Best Copy Trading Platform
- Best Proprietary Trading Firms for Beginners
- Best Stocks for Options Trading
- Silver Bullet Trading Strategy
- Order Block Trading Strategy
- The Strat Trading Strategy
- Supply and Demand Trading Strategy
- Profitable Gold Trading Strategy
- Higher High Lower Low Trading Strategy
