


12 Best Charting Software for Day Trading
12 Best Charting Software for Day Trading ranked by features, usability, and value—find the best tools to support your trading strategy.

Spotting profitable Trading Patterns starts with clear, fast charts and the right indicators. Have you ever watched a trade slip away because your chart lagged or a signal looked different across time frames? This guide compares the best charting software for day trading, from candlestick and volume analysis to order flow, backtesting, customizable indicators like moving averages, RSI, and MACD, alerts, drawing tools, and low-latency data, so you can confidently select and master the ideal charting software to boost day trading profits through precise entries, exits, and real-time analysis.
To help with that, Aquafutures offers funded accounts for futures trading that put real capital, professional data feeds, and fast execution in your hands so you can test platforms, refine patterns, and practice precise entries and exits without risking your own funds.
Summary
- Feed quality and latency are decisive for real fills, not just visuals, because spikes of 150-300 ms force sizing changes. Over 70% of day traders use charting software, making feed fidelity an operational constraint rather than an academic detail.
- Accurate live-like testing requires tick-level databases and order-book replay. Modern engines can process up to 1 million data points per second, and a recommended 10-session market-replay stress test helps surface execution failure modes before scaling.
- Hard, non-bypassable risk gates, immutable journaling, and deterministic sizing rules are essential, with the guide advising a seven-session hybrid validation and zero critical mismatches across three consecutive sessions before taking funded-size positions.
- Make journals irrefutable by archiving four immutable artifacts per trade, hashing each bundle, and retaining them for two years so auditors can replay every chart image, order ticket, DOM snapshot, and broker fill.
- Vendor guarantees and data licensing affect uptime and evidence access, so treat about $50 per month as a baseline cost for premium charting tools while weighing that against the risk of a disputed payout or failed evaluation.
- Optimize ergonomics and execution confidence by limiting on-screen decision points to three, mapping five primary hotkeys, and using a rolling 30-second confidence score that combines fill deviation and reject rate, given that 90% of successful day traders rely on advanced charting tools and muscle memory.
- This is where Aquafutures's funded accounts for futures trading fit in, by providing instant funding, simulated live conditions, and clear payout paths so traders can validate charting stacks and produce auditable performance under funded-account rules.
12 Best Charting Software for Day Trading
These twelve platforms represent the practical choices traders use to build repeatable intraday performance, not abstract toolkits. I’ll map each one to the specific needs that matter for funded futures trading: live-like execution, low latency, reliable alerts, trade journaling, and built‑in risk controls that prove consistency under simulated capital rules.
1. TradingView
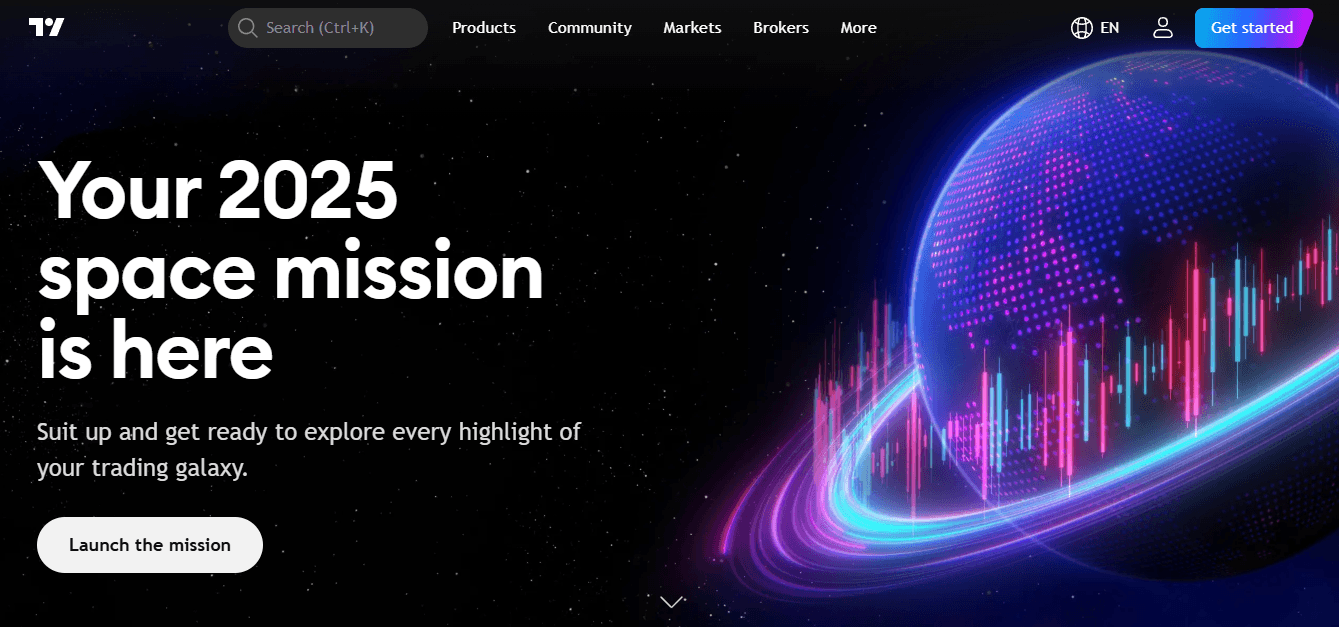
TradingView is a leading platform for day traders seeking robust, visually appealing charts across multiple asset classes. Its design prioritizes intuitive navigation and deep customization, making it ideal for real-time analysis of stocks, forex, and crypto. Traders appreciate its smooth blend of technical tools and social features that enhance decision-making without overwhelming the interface.
Key Features
- Over 100 built-in indicators and 14 diverse chart styles for precise technical setups.
- Support for 20+ time intervals, from tick charts to monthly views.
- 90+ drawing instruments to mark trends, support levels, and patterns.
- Unique ability to plot fundamental metrics like earnings and revenue directly on price charts.
- Thriving community sharing over 100,000 custom scripts and live idea streams.
2. TradeStation
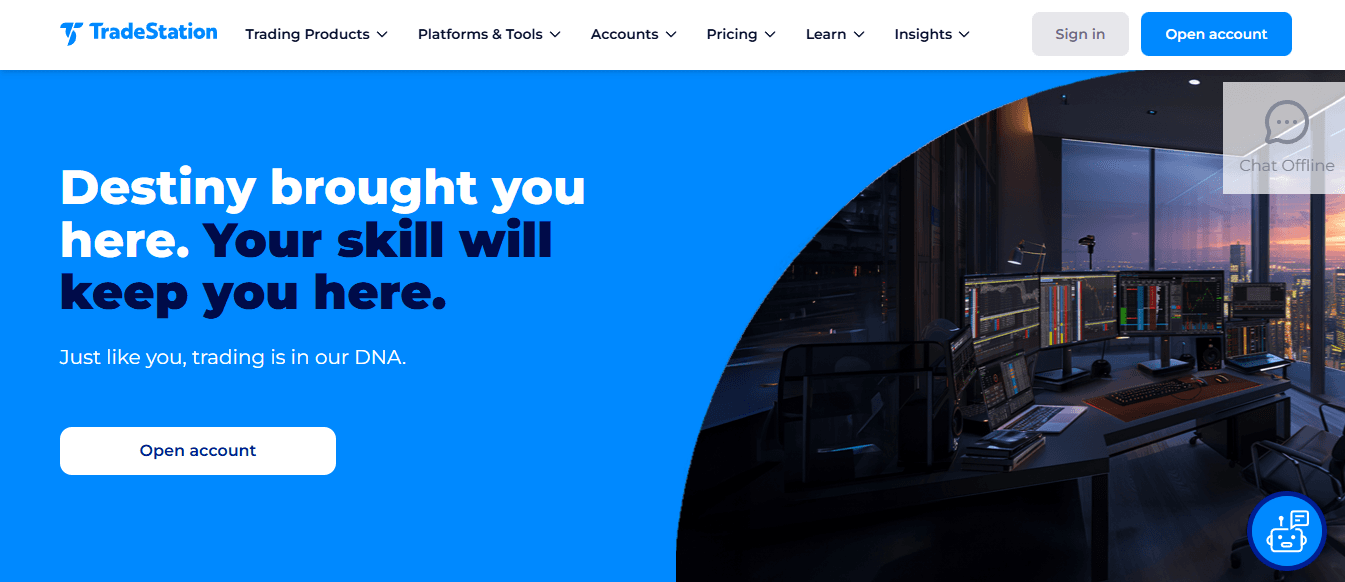
TradeStation excels for day traders who want powerful charting bundled with brokerage services, offering smooth execution right from analysis windows. Its proprietary tools deliver advanced scanning and visualization, perfect for high-volume intraday strategies. The platform's depth shines on desktop but extends effectively to mobile for on-the-go monitoring.
Key Features
- Chart Analysis window combining price data, backtesting, and live order placement.
- RadarScreen scanner with 329 filters for real-time alerts and watchlists.
- Matrix tool merging market depth, signals, and quick trade entries.
- Access to nearly 300 indicators backed by 40+ years of historical data.
- Mobile stylus support for precise drawing on touch devices.
3. TrendSpider

TrendSpider transforms day trading with AI-powered automation that detects trends and patterns without manual input, saving hours during fast markets. Built for technical enthusiasts, it simplifies complex backtesting and alerts, allowing traders to focus on execution rather than setup. Its innovative approach outperforms traditional platforms in dynamic environments.
Key Features
- Automatic trendline detection with backtested performance rankings.
- Recognition of 40+ candlestick formations for instant bullish/bearish signals.
- Dynamic alerts based on full chart patterns, not just price levels.
- No-code strategy tester for rapid parameter adjustments.
- Intraday data support on premium tiers for precise scalping.
4. Stock Rover

Stock Rover allows day traders to manage multiple positions with superior portfolio visualization and metric tracking. It transforms raw charts into actionable insights via comparative performance views, ideal for optimizing intraday holdings. The platform's broker integrations streamline workflows for active portfolio adjustments.
Key Features
- 650+ financial metrics for custom chart overlays and screening.
- Automated rebalancing tools with price and performance alerts.
- Benchmark comparisons against indices like the S&P 500 or custom portfolios.
- Four specialized valuation charts for multi-angle investment assessment.
- Easy syncing with 100+ brokers for real-time position updates.
5. Benzinga Pro

Benzinga Pro merges high-speed news feeds with TradingView-level charts, giving day traders an edge on event-driven moves. Its real-time alerts on unusual activity help spot opportunities before they fully develop. This makes it invaluable for momentum plays tied to breaking market stories.
Key Features
- Full TradingView integration for advanced charting within the app.
- BZ Signals alerting on price spikes, options volume, and block trades.
- Customizable news squawk with live audio from analysts.
- Filters for halts, gaps, highs/lows, and unusual trading events.
- Real-time data on premium plans for sub-minute precision.
6. Finviz
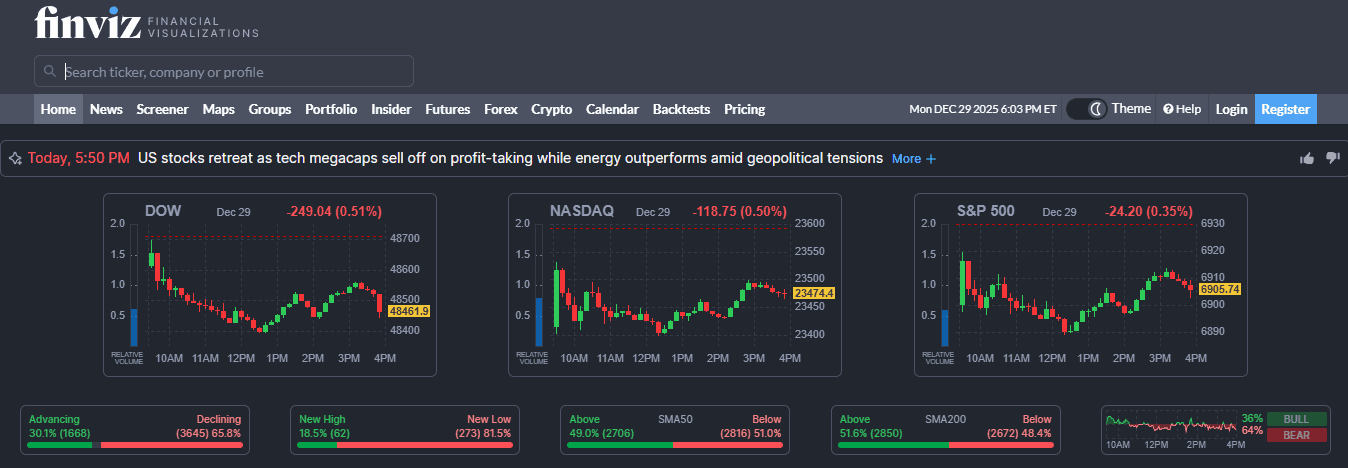
Finviz delivers quick, no-fuss stock scanning paired with snapshot charts, making it a go-to for day traders spotting intraday setups across thousands of names. Its minimalist design cuts through clutter, enabling fast filters on technical and fundamental criteria to build watchlists in seconds. Elite upgrades unlock real-time data essential for time-sensitive entries.
Key Features
- 67+ filters blend descriptive, technical, and fundamental data for precise scans.
- 13 display modes, including charts, heat maps, and performance tables.
- Instant chart previews with major indicators overlaid.
- News, insider trades, and analyst ratings aggregated per stock.
- Intraday and real-time quotes on the paid Elite tier.
7. StockCharts
StockCharts prioritizes straightforward, high-contrast charts suited for day traders, blending intraday action with broader trend context. Its deliberate refresh cadence avoids overload during volatile sessions and focuses on reliable overlays and scans. The free tier supports basic sharing, while paid plans offer deeper customization.
Key Features
- PerfCharts stack up to 10 symbols for relative strength analysis.
- Point & Figure format filtering noise with X/O price plotting.
- Seasonality tools track recurring patterns over custom periods.
- 25+ indicators and overlays per chart on basic paid access.
- SharpCharts engine for annotated, exportable visuals.
8. Webull

Webull shines for day traders glued to their phones, offering commission-free trading with responsive touch charts that rival desktop power. Its focus on speed suits scalpers chasing quick fills without menu diving. Extended hours visibility keeps momentum plays alive beyond regular sessions.
Key Features
- 50+ technical studies and multi-timeframe overlays.
- Dynamic after-hours and pre-market price tracking.
- One-tap order entry directly from the chart gestures.
- Custom watchlists with heat map integrations.
- Paper trading mode for risk-free intraday practice.
9. Interactive Brokers
Interactive Brokers equips tech-forward day traders with the Trader Workstation's dense toolkit for multi-asset scalping worldwide. Low-latency executions pair with exotic indicators, ideal for arbitrage across 150+ markets. Free access via a brokerage account lowers entry barriers.
Key Features
- 120+ indicators, including ADX/DMI and Zigzag patterns.
- Hotkey-driven chart trading for millisecond precision.
- Coverage of stocks, options, futures, forex, and crypto globally.
- Customizable layouts with depth-of-market feeds.
- TradingView sync for hybrid advanced setups.
10. thinkorswim
thinkorswim from Schwab packs unmatched depth for day traders dissecting complex setups, with glitch-free multi-chart grids handling heavy data loads. Its modular design allows users to build personalized dashboards for options, futures, or equities. Free with brokerage, it demands time to master but rewards with precision.
Key Features
- Up to 28 charts in flexible grid configurations.
- Super gadgets like trading ladders and custom buttons.
- Analyze tab for instant risk profiles on trades.
- Hundreds of studies with ThinkScript for custom code.
- Smooth real-time streaming across all devices.
11. Sierra Chart
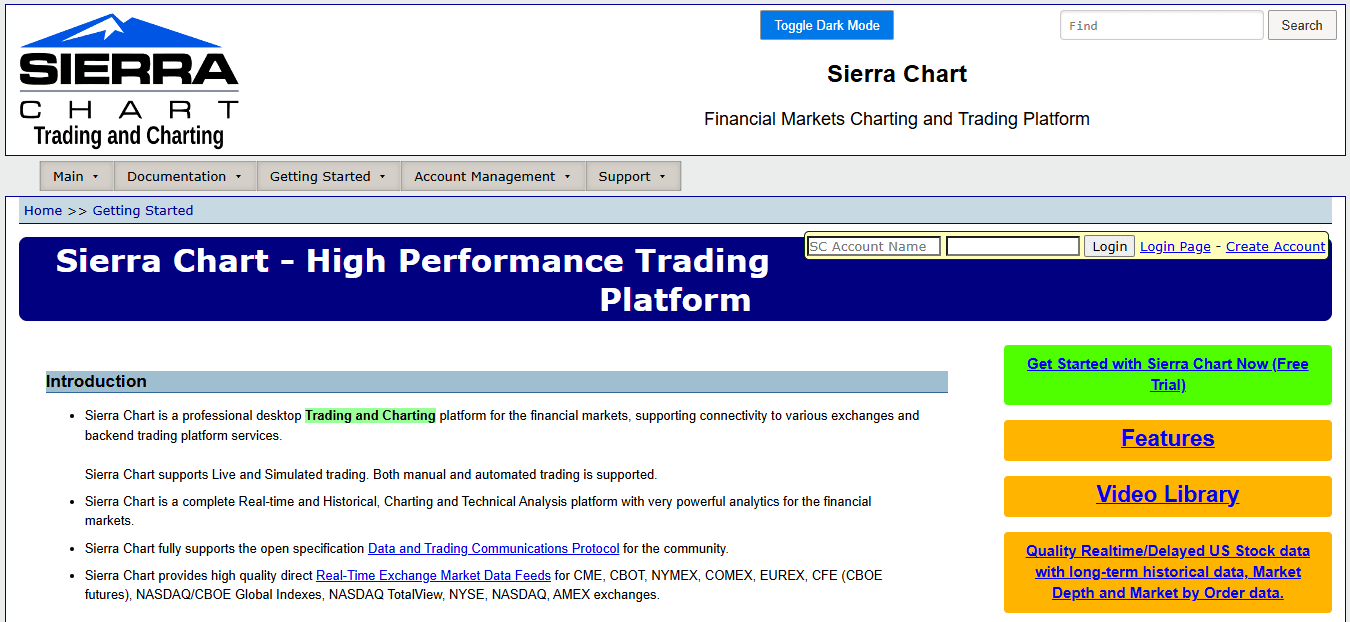
Sierra Chart caters to serious day traders demanding low-latency, customizable charting with unmatched data granularity for futures and stocks. Its engineering-first approach supports advanced order-flow analysis and thrives in high-frequency environments where every tick counts. Remote access keeps setups portable without performance dips.
Key Features
- Hundreds of technical studies and custom study development.
- Advanced order flow with footprint and volume profile charts.
- Sub-millisecond data feeds from multiple exchanges.
- Extensive backtesting with historical tick replay.
- Multi-monitor support and automated trading integration.
12. NinjaTrader

NinjaTrader allows day traders with a flexible ecosystem for charting, automation, and simulation, bridging manual analysis to algorithmic execution. Its marketplace of add-ons expands capabilities for niche strategies like market profile trading. The free simulator version accelerates skill-building without capital risk.
Key Features
- 100+ built-in indicators and NinjaScript for custom logic.
- Advanced charting with market replay for practice sessions.
- Order flow suite including cumulative delta and volume wedges.
- Ecosystem of third-party apps and automated strategies.
- Multi-broker connectivity for optimal execution routing.
Status quo, hidden cost, and the bridge
Most traders start by gluing together free charts, a broker app, and a news feed because that workflow is familiar and cheap. That approach works in quiet markets, but when evaluation rules enforce strict drawdowns, inconsistent data feeds, and slow execution create a hidden tax: rules get violated, payouts stall, and confidence erodes. Teams find that funded-account platforms like AquaFutures remove the bottleneck by providing instant funding terms, reliable capital sizing, and payout predictability, so traders can focus on choosing charting and execution tools that preserve latency and proof of performance.
After guiding a trader through a four-week evaluation, the pattern was evident: ambiguity in rules or unreliable charting produced reactive trades and emotional fatigue. That exhaustion is why chart choice is not cosmetic; it is infrastructure. The right stack keeps your head clear and your rule set defensible when auditors request trade evidence.
A short analogy to make this concrete
Think of your charting platform as the cockpit instruments for a small plane; clear, consistent gauges let you fly by the book. When instruments lag, you are flying blind; the safest decision is to fly smaller and perform fewer maneuvers.
Which tool should you pick for passing and sustaining funded accounts?
Match the platform to the constraint you care about first, latency second, and features third. If you need low-touch automation with strong pattern validation, choose an automated detection platform. If live execution and diversified venue access are most important, choose a brokerage-integrated workstation. When you need a portable practice environment that mirrors your live route, select an app with market replay and strict journaling. That simple decision changes how you trade under rules and how quickly you stabilize toward target profit goals. But the real reason choosing a charting tool matters goes deeper than speed or indicators.
Related Reading
- What Is a Funded Trading Account
- What Is SMT in Trading
- Price Action Trading
- Intraday Trading Tips for Today
- Can Day Trading Be Profitable
- Trading Indicators
- Forex Trading Candlestick Patterns
- Intraday Algorithmic Trading
- Trading Candlestick Patterns
- Volatility Trading
What is a Day Trading Charting Software, and How Does It Work?

Charting software turns raw market feeds into decision-grade instruments, synchronizing price, volume, and order-book data so you can trade with speed and repeatability. The best platforms do more than draw candles; they recreate execution realities, enforce risk limits, and keep an auditable trade history you can defend under funded-account rules.
How does the data actually get to your chart, and why should you care?
Data flows through multiple layers: exchange feeds, aggregation services, and your charting engine. Each stage can add milliseconds, drop ticks, or alter timestamps, so choose platforms that show feed source, packet lag, and quote density in real time. According to Obside, in 2025, over 70% of day traders use charting software to analyze market trends, which makes understanding feed quality less academic and more operational, because your edge lives in the gap between a displayed price and the price you can actually fill.
What makes a chart feel like the live market instead of a polished replay?
Look for tick-level historical databases and market-replay engines that simulate order flow, not just price series. Accurate live-like testing includes configurable slippage models, queue-position emulation, and order-book replay, so your backtests expose execution failure modes. I recommend measuring replay accuracy by comparing a sample session, tick-for-tick, against a recorded live feed and noting differences in fills, latency, and slippage before you migrate any strategy into sized positions.
Which features force discipline during a high-pressure session?
Platforms that matter include hard, non-bypassable risk gates, automated bracket orders tied to position size, and immutable journaling that stamps entries with exchange timestamps. This is not just bureaucracy. When traders face sudden account reviews or opaque payout holds, they tighten size and trade differently, which erodes PnL and consistency; that pattern appears across evaluation contexts and usually stems from a lack of transparent, auditable trade controls in the stack. Solutions like AquaFutures provide instant funding and clear payout terms, paired with simulated capital that mimics live conditions, so traders can run with consistent size and documented performance instead of shrinking into survival mode.
Most teams handle charting the familiar way, gluing free charts to a broker app because it is quick and cheap. That works until an ambiguous rule, a delayed payout, or a surprise review forces a conservative response and results in realized opportunity costs. Platforms such as AquaFutures address that friction by offering immediate capital access, explicit payout paths, and 24/7 support, letting traders focus on consistent execution and auditable trades rather than firefighting account status.
How do microstructure views change what you actually do on screen?
Volume-delta footprints, order-flow heatmaps, and local liquidity profiles show where real counterparts are likely to be, not where a simple moving average says the market should go. Using these views shifts entries from predictive one-off guesses to context-aware decisions, so you can size into liquidity and avoid getting clipped. Treat these as complements to your primary chart, not decorative extras.
What should you validate before you trust a platform with funded capital?
Test feed redundancy, confirm exchange-level timestamps match your broker fills, run a 10-session market-replay stress test with your exact order types, and log every disconnect, failed cancel, and slippage event. Also, verify the platform enforces hard daily-loss limits and records them immutably. The tooling market is expanding fast, so the vendor ecosystem will continue improving these capabilities as demand rises, as shown by projections that LinkedIn Pulse, 2025, estimates the Day Trading Software Market will grow from 4.2 billion USD in 2024 to 10 billion USD, which means newer options will offer stronger execution realism and tighter integrations if you vet them carefully.
Think of your charting stack like an engine room with multiple pumps and gauges: a single failing gauge does not ruin the flight, but a hidden lagging instrument will force you to land. Build redundancy, test under pressure, and demand tools that produce auditable proof of consistent behavior so you are judged on performance, not excuses. That simple setup technique seems complete until you spot the oversight that quietly undermines repeatability.
How Do You Set Up Charting Software For Day Trading?

Set up your charting stack as a validation pipeline, not a vanity display: prove the feed is identical to the fills, automate hard risk gates, and keep an immutable, time‑stamped trade record you can hand to an auditor. Do those three things first, and the rest of your layout, indicators, and alerts become tools for execution, not excuses.
How do you confirm the feed you see matches the fills you get?
Start by identifying the exact feed source and recording its exchange timestamps alongside every order. Use NTP or PTP synchronization on your workstation to prevent timestamp drift, and capture short, repeatable tests—for example, place 20 synthetic limit orders across the open and record quote-to-fill differences. Monitor packet loss and measure median quote latency in milliseconds, not seconds; when spikes of 150 to 300 ms appear, your sizing rules must change because late fills are a slow bleed to consistency.
What stress tests actually prove the stack under real pressure?
Run scheduled replay and live hybrid tests, combining market-replay sessions with a mirrored live feed for five to ten full trading days, and log every missed cancel, rejected order, and slippage event. Modern engines can ingest enormous volumes, and Day trading charting software can process up to 1 million data points per second. Use that capacity to replay order-book depth while injecting configurable slippage so your backtests surface execution failure modes, not just theoretical edge.
When should you hard-code automated risk controls?
Treat risk gates as part of the platform, not optional macros. Set non-bypassable daily-loss ceilings in the trading layer, tie position-size caps to real-time latency metrics, and implement automatic size reduction when your feed metrics cross predefined thresholds. This preserves account health on bad-connection days and creates auditable behavior, the very evidence evaluators look for when they check whether profits were repeatable, not lucky.
Most traders glue free charts to a broker app because it feels quick and familiar. That works until a review requests precise timestamps and your screenshots do not match the exchange logs, at which point months of performance can become a disputed story. Teams find that solutions like AquaFutures, which offer instant funding, up to $450K in capital, clear payout paths, and 24/7 support, remove that secondary friction so traders can focus on proving consistent rules rather than defending inconsistent tooling.
How do you build an irrefutable trade journal?
Treat each trade like legal evidence. For every executed trade, automatically archive the chart image, DOM snapshot, order ticket, and broker fill with the exchange timestamp in one folder, then hash and version it in cloud storage. Export the raw order CSV with fill IDs, attach a one-line rationale, and keep a short replay clip of the same sequence. If an auditor asks why you entered or why a fill differed, you want a single folder that tells the full, timestamped story.
What cadence of checks keeps your setup honest?
Run quick latency audits daily, whole replay stress tests monthly, and do a five-session validation before any funded-account run. Track three metrics daily: median quote-to-display lag, mean quote-to-fill lag, and packet loss percentage. If any metric exceeds a defined threshold, pause sizing, run a focused replay, and resume only when the pipeline proves repeatable.
Practical automation tips that save time and build credibility
Use the platform API to script exports, so nothing is manual the night before a review. Schedule immutable exports at 00:00 UTC, include raw exchange-level logs, and push them to off-site storage with versioning. This simple automation converts scattershot evidence into a defensible performance ledger, which changes how reviewers interpret your results. You think that fixes it, but the next failure mode is quieter and more complicated to spot — and it’s where auditors finally decide if your track record was engineered or earned.
Related Reading
- Basic Trading Strategy
- Spot Algorithmic Trading
- Forex Trading Profit Per Day
- Crypto Trading Bot Strategies
- Best Forex Trading Bots
- Fair Value Gap Trading Strategy
- Best Leading Indicators for Day Trading
- Best Indicators for Swing Trading
- Best Indicators for Options Trading
What Are The Key Features To Look For In Day Trading Charting Software?
Pick software that treats charts as living instruments, not pictures: the right tool enforces live-like execution, reduces cognitive load, and automates rule-based risk so you can prove repeatable performance under funded-account rules. Focus on platforms that provide a continuous confidence score for execution, ergonomic controls for fast entry, and immutable logs that auditors can trace back to raw exchange data.
How should execution confidence be measured in real time?
Treat latency and fill behavior as a single confidence metric, updated every few seconds. Build a rolling 30-second confidence score that combines recent fill deviation, order reject rate, and queue churn, and let that score automatically scale position size and switch order types, so your sizing is an output of current market fidelity, not a gut call. This eliminates mental arithmetic during high-pressure opens and establishes a simple, auditable rule that demonstrates you traded within constraints.
What UI choices actually reduce mistakes under stress?
Limit on-screen decision points to three per layout, map five primary hotkeys for entry, exit, scale, stop, and cancel, and use color and motion only to show deviations from your rule set. The familiar clutter of many indicators steals attention; a clean, tactile UI keeps your hands and eyes synchronized so timing errors drop and focus returns faster after a shock move. This is not aesthetic; it is a reliability tradeoff: fewer choices, clearer discipline.
How should alerts avoid creating noise instead of discipline?
Design alerts as graded events: advisory, actionable, and interruptive. Advisory updates your watchlist, actionable pre-fills an order ticket for one-click confirmation, and interruptive blocks new entries until you acknowledge a critical risk breach. Make conditional logic accessible to templates so complex rules are replicated reliably rather than rebuilt in memory each session. Traders tell us it is exhausting when conditional logic is buried and brittle; tiered alerts prevent that exhaustion while enforcing the exact behavior you promise to auditors.
Most teams manage evaluation runs by gluing free charts to a broker because it is familiar and quick. That works until feed problems or opaque payout rules force shrinkage and lost opportunities, because fragmented tools create gaps in evidence and inconsistent sizing. Teams find that platforms like AquaFunded, which offer instant funding up to $450K, clear payout pathways, and round-the-clock support, let traders stop firefighting account status and instead pick charting stacks that preserve latency, enforce hard risk gates, and produce defensible performance.
Which logging practices make a trade journal irrefutable?
Archive four immutable artifacts per trade: raw exchange snapshot, order ticket with API ID, chart image with UI state, and a short replay clip. Hash each bundle and keep automated diffs that highlight any mismatch between chart timestamps and fills. Retain these bundles for two years with role-based access, and surface anomaly tags when fill behavior deviates from expected slippage, so reviews become focused technical audits rather than memory games.
How do you plan for partial outages without abandoning a run?
Predefine an outage playbook: if confidence score falls below your threshold, immediately reduce size by a deterministic factor, switch to limit-only executions, and engage a manual-only watchlist that mirrors your key levels. Automate the handoff so the trader needs only to confirm a single consent click. This keeps exposure consistent and preserves the proof that you traded to rules, not panic.
Why does ergonomics matter as much as features?
Because execution is muscle memory, the platform that wins is the one you can operate on when your heart rate spikes. Optimize for muscle memory: consistent button placement, minimal modal dialogs, and one-second visual confirmation on fills. These small design choices compound into fewer mis-entries and steadier runs, the exact behavior evaluators look for when judging whether profits were earned methodically or accidentally, and they explain why 90% of successful day traders rely on advanced charting tools.
How should teams validate a new charting stack before risking sized positions?
Run a seven-session hybrid test that mixes market replay and a live micro-portfolio, log every mismatch, and require zero critical mismatches across three consecutive sessions before scaling. Build automation that exports your validation run as a single, time-stamped package that an auditor can replay. Doing this repeatedly demystifies edge cases and turns confidence into repeatable evidence rather than hope, which matters because over 70% of day traders use charting software to analyze market trends. You think that fixes it, but the next obstacle hides in how you translate that evidence into decisions under pressure — and that’s where things get complicated.
How to Choose the Best Charting Software For Day Trading

Pick the charting tool that gives you predictable, testable behavior under real stress, not the fanciest indicator list. Focus on measurable vendor guarantees, API stability, and a reproducible validation plan that proves the platform will behave the same way when you trade for real money. Those practical checks separate hobby setups from infrastructure you can rely on as you scale funded-account size.
What should I test under live pressure?
Run three staged live tests, each with increasing size and identical rules, and log every discrepancy. Start with micro-size trades for three market opens, then scale to a small live portfolio for five full sessions, and finally run two funded-size days while keeping everything immutable and time-stamped. The key metric is consistency, measured by quote-to-fill deviation, reject rate, and the percent of sessions that meet your rule set without manual overrides.
How do vendor promises and data licensing affect daily uptime?
Read the provider's SLA and data license before trusting a platform with your data. Look for published uptime, quoted median latency to major exchanges, and explicit terms about historical tick access and export rights. If a vendor restricts raw exchange exports or locks you out during an outage, you lose the ability to produce auditable evidence, which matters when evaluators or auditors ask for the raw logs behind a winning day.
When should you favor a mature API over a slick UI?
Choose an API-first platform when you need automation, reproducible backtests, or programmatic exports tied to audits. Scripting languages and SDK maturity determine how reliably you can automatically export chart images, order tickets, and broker fills. If your plan requires nightly immutable archives and automated hashing, prioritize API robustness and versioned change logs over a polished interface.
How do you vet community indicators and third-party scripts?
Treat community scripts as hypotheses, not trade-ready tools. Create a short validation checklist: run each script across 50 nonconsecutive trading days in replay mode, measure signal longevity, and audit the code for hidden state or order calls. If a script produces an edge in backtest but fails more than 20 percent of stress sessions, retire it or encapsulate its signals behind deterministic gating logic.
What redundancy and failover should your stack include?
Plan for vendor outages with at least two independent feeds and a mobile failover that can execute your core hotkeys. Use a simple rule: if primary confidence falls below the threshold, automatically reduce size by a preassigned factor and switch to limit-only orders. That deterministic fallback preserves account health and keeps your behavior auditable, rather than forcing ad-hoc decisions during chaos.
Most teams handle this by gluing a chart, a broker app, and a news feed because it is familiar and quick. That works until an outage or a disputed fill forces hours of manual reconciliation, and months of performance can become a credibility problem. Teams find that platforms offering instant funded capital and transparent payout processes provide a structural bridge, as these solutions remove the secondary friction of account uncertainty and allow traders to focus on tools that deliver repeatable, auditable performance.
How should you judge the long-term total cost of ownership?
Compare monthly fees to predictable benefits, not feature lists. Since Koyfin Blog reports the average cost of premium charting software is $50 per month, treat that as baseline infrastructure expense and ask whether the platform saves you time in audits, reduces slippage, or prevents a single critical rejected order. If a $50 subscription prevents one misfilled trade that would otherwise derail a funded evaluation, it pays for itself.
Why does practical social proof matter more than star ratings?
Look for reproducible validation, not popularity. While adoption numbers are a signal of community support, what matters for funded runs is whether the platform has a track record of stable, low-latency delivery at peak hours. Given that [Koyfin Blog notes over 50% of traders use charting software for technical analysis, your choice should be driven by proven uptime during the specific session windows you trade, not by overall popularity across all timeframes. A short race-car image will help: telemetry that only updates after a lap is useless in a pit stop, so choose the tools that stream live telemetry when you need to make a split-second call. That simple change in thinking reveals a question you will not be able to ignore next.
Unlock up to 50% off Your First Funded Account for Futures Trading
If you're ready to convert repeatable chart setups into funded size and steady payouts, consider AquaFutures as the bridge from proven charts to real capital, with instant account options, clear rules, and fast payouts so you can trade with momentum instead of admin drag. Pair your favorite charting software for day trading with their no-eval challenges or performance-based growth to keep more profits, use up to 50% off your first funded account, plus surprise BOGO deals and weekly bonuses to lower your entry cost, and rely on transparent rules and fast support while you scale.
Related Reading
- Fibonacci Trading Strategy
- Best Prop Trading Firms
- ORB Trading Strategy
- Crypto Swing Trading Strategy
- Best Copy Trading Platform
- Best Proprietary Trading Firms for Beginners
- Best Stocks for Options Trading
- Silver Bullet Trading Strategy
- Order Block Trading Strategy
- The Strat Trading Strategy
- Supply and Demand Trading Strategy
- Profitable Gold Trading Strategy
- Higher High Lower Low Trading Strategy
