


The Ultimate Guide to Volatility Trading Like a Pro
Volatility Trading explained with clear strategies for sizing, risk control, and execution. Learn practical tactics and funded support from AquaFutures.
Market volatility can shift trading conditions in an instant, with sudden surges in implied volatility and rising premiums disrupting even the most calculated strategies. Tools like Trading Patterns help decipher market signals such as volatility spikes, skew, and options Greeks to identify setups suited for straddles, strangles, and hedged positions. A clear strategy and defined risk parameters enable traders to transform unpredictable movements into consistent trading opportunities.
Structured risk rules not only minimize losses but also convert market fluctuations into steady income. AquaFutures offers funded accounts for futures trading that deliver real capital, integrated risk controls, and scalable opportunities for volatility trading success.
Summary
- Volatility trading is about trading the size of moves, not direction, and options play a central role in that market, with options accounting for approximately 20% of total US equity trading volume (IG, 2019).
- Liquidity and leverage amplify shocks, with average daily trading volume increasing about 50% during high-volatility windows and overall market volatility rising roughly 30% year over year (IG, 2019; Fidelity, 2025).
- Accurate volatility measurement is critical for sizing and stops, for example, aggregating 78 five-minute returns per day and annualizing by 252 trading days produces empirical realized volatility, while responsive EWMA models often use a decay factor near 0.94 for daily horizons.
- Execution and market structure matter more than raw signals, so staggered entries, midpoint limit orders, and defined-risk multi-leg structures reduce slippage and tail risk, and this is reflected in practitioner behavior where over 50% use volatility indices and 75% use volatility indicators as tactical inputs (EdgeClear, 2023; XS Blog, 2023).
- Trader psychology is a major performance factor, and short simulated programs show it matters: a referenced two-week simulation found that traders who rehearsed their trade lifecycle under realistic fills and scaled capital made fewer impulsive changes during real spikes.
- Scale decisions should follow volatility targeting and consistency rules, not intuition, for example, sizing to a 6 percent evaluation objective and applying staged increases after predefined streaks, with studies suggesting disciplined volatility strategies can increase returns by up to 30% in volatile markets.
- Aquafutures's funded accounts for futures trading address this by providing instant access to scaled capital and simulated runways, so traders can rehearse sizing, hedging, and execution under realistic fills without risking personal capital.
What is Volatility Trading, and How Does It Work?
Volatility trading focuses on the magnitude of movements rather than their direction. Traders earn profits by predicting or reacting to changes in implied and realized volatility. They use futures, options, and volatility-linked ETFs to capture that movement while protecting against directional risk. If you're interested in exploring opportunities, consider our funded accounts for futures trading to get started.
How do traders show volatility without picking a direction?
Traders use tools that directly price uncertainty, such as short-dated VIX futures, out-of-the-money option structures, and delta-neutral option spreads that benefit from rising or falling implied volatility. Liquidity is critical, as options account for a significant share of market activity and execution can occur at scale. For example, options accounted for about 20% of total trading volume in the US equity markets in 2019, as explained by IG International. This shows why advanced order techniques and margin management are practical for active volatility desks. In simpler terms, traders focus on vega exposure and manage gamma, rather than simply buying calls or puts and hoping for a favorable outcome.
How should you size positions and plan for spikes?
Size positions by expected volatility rather than by fixed dollar bets. Use volatility targeting: if your goal is a steady 6 percent return for each evaluation period, adjust option vega so that a standard deviation move matches your risk tolerance. Expect liquidity to act differently during a market storm. One study found that during times of high volatility, the average daily trading volume increases significantly. This fact affects slippage and fill probability and requires you to change how you size and ladder executions. This is shown by a study that found that during periods of high volatility, the average daily trading volume in the US stock market increases by 50% (2019).
What execution tactics actually move the needle?
Effective execution tactics include using staggered entries and placing limit orders near the midpoint during widening spreads. Additionally, building multi-leg option structures helps limit tail risk. Gamma scalping requires real-time delta hedging and low-latency fills. If quick rebalancing is not possible, it's better to choose defined-risk spreads. For volatility ETFs, it is crucial to consider the term structure and roll costs, as contango can slowly erode long exposure over weeks. Treat slippage and roll as recurring expenses, not surprises.
Why does the emotional cost matter as much as the math?
This challenge happens during geopolitical shocks and earnings cycles. Traders often wake up to profitable positions from the night before, only to feel a knot of panic when the VIX or related ETFs experience significant changes. This anxiety can change decision-making, turning a clear plan into reactive behavior. Practicing in simulated, reward-backed accounts helps reduce that shock, allowing traders to follow established rules rather than being driven by adrenaline.
What can we learn about market volatility?
The following section examines the forces that drive markets into unstable states. It will explore why some shocks lead to big price changes while others hardly make a splash.
Related Reading
- What Is a Funded Trading Account
- What Is SMT in Trading
- Price Action Trading
- Intraday Trading Tips for Today
- Can Day Trading Be Profitable
- Trading Indicators
- Forex Trading Candlestick Patterns
- Intraday Algorithmic Trading
- Trading Candlestick Patterns
What Causes Market Volatility?
Volatility stems from a mix of concrete triggers and weaker market systems, not from a single factor. Political surprises, unexpected economic news, sudden liquidity gaps, crowded positions, and sectoral disruptions serve as fuses. When these fuses connect through leverage or thin markets, price changes can happen quickly and widely. To navigate this landscape effectively, consider exploring funded accounts for futures trading that can enhance your trading strategy.
How do political and geopolitical moves start a chain reaction?
How do political and geopolitical moves start a chain reaction? When a government changes trade policy, dumps bonds, or restricts key exports, risk premia reset immediately. This is not just a theory; it is practical: the sell-off of U.S. Treasuries linked to strategic moves often leads to a simultaneous drop in both stocks and bonds. This pattern signals deeper confidence issues rather than a simple reallocation. That kind of political shock forces traders to rethink counterparty risk, supply risk, and currency exposure simultaneously. The result is that cross-asset flows increase volatility because liquidity that seemed reliable a week earlier disappears.
When do economic data and central bank action become volatility multipliers?
Economic data and central bank actions can create volatility multipliers. Surprises in employment, GDP, or inflation need real-time changes to plans, and markets often punish missed expectations. Central bank policy can act like a sharp accelerator. For example, the Federal Reserve raised interest rates by 0.75%, which contributed to market volatility, according to Fidelity in 2025. This change leads to quick and uneven adjustments in discount rates and financing costs across different portfolios. As a result, a large rate hike usually lowers equity valuations and forces duration-sensitive funds to rebalance. This leads to pockets of selling that interact with concentrated options and futures positions, ultimately widening market moves.
Why do liquidity and leverage turn small shocks into big swings?
Liquidity is contextual, not constant. When order books thin, a normal-sized trade can become a market-moving trade. Adding concentrated leverage or short-gamma option books creates a feedback loop during rebalancing: dealers hedge by buying or selling the underlying asset, which pushes prices further and triggers additional hedging. The result is outsized intraday moves and erratic spreads. This structural effect explains the significant changes in activity patterns over the past year. According to Fidelity, market volatility increased by 30% compared to the previous year, reflecting the growing fragility of liquidity. This emphasizes why execution and sizing are more critical than ever.
How do personal trading strategies cope with volatility?
Most traders use their own money or slow-scaling methods because these approaches are familiar and easy. This method works well until a liquidity shock occurs; at that point, accounts with low balances must make difficult decisions. They might need to reduce their position size and risk missing major market moves, or they might take on excessive leverage, which can trigger margin calls. Platforms like funded accounts for futures trading help with this problem by offering quick funding up to $450K, simulated capital with tangible rewards, up to 100% profit split, fast weekly payouts, and 24/7 support. This gives traders the ability to use well-planned, scaled strategies without relying on high leverage during market volatility. Teams find that easy access to capital and practice on simulated runways accelerate decision-making and maintain position integrity during sudden market changes.
How does investor psychology lock in volatility?
Investor psychology plays a significant role in driving volatility. Crowded trades and fear create reflexive markets. When many traders are in the same position, even a small amount of new information can trigger a rush to sell. Traders often call rallies "temporary spasms" and sell when prices go up. This selling creates additional weakness and can turn a minor correction into a larger downward trend. The emotional aspects mean that technical triggers, such as stop orders, broken levels, and option pinning, are not only mechanical; they are also social signals that speed up price movements.
What role do sector shocks and corporate news play in systemic moves?
Sector shocks and corporate news are key drivers of significant market changes. Events that might seem separate, such as a semiconductor shortage or a considerable strike, can have a domino effect because companies are closely interconnected. If a supplier experiences issues, it can cause production slowdowns for many OEMs. This can lower earnings estimates and change the risk in related industries. Corporate surprises, such as missing earnings targets, revising forecasts, and leadership changes, can trigger local market swings that affect index futures. This is especially true when large companies or ETF adjustments are involved. When these minor shocks happen during slow trading times, they can amplify larger market trends, resulting in unusual reactions across different assets.
How do panic and liquidity constraints affect market behavior?
Consider a crowded theater where someone shouts. The panic isn't just about the shout itself, but also about the exits and how people are lined up. In financial markets, exits stand for liquidity and extra leverage. When either is limited, even standard shocks can cause chaotic reactions. This shows why understanding how triggers connect is more important than predicting any one event.
What is the underlying data driving market volatility?
More exists beneath the surface than headlines reveal. The next section will show the numerical heart of these dynamics.
How to Calculate Market Volatility

Trading volatility is measured by turning price changes into a consistent series of returns. This involves choosing a sampling frequency and using a statistical estimator that fits your timeframe and execution needs. After that, annualize and stress-test that estimate to check for model and sampling biases. For short-term sizing, use high-frequency realized measures. For near-term forecasts, use smoother models like EWMA or GARCH. When you need efficiency from little data, range-based estimators work best.
When figuring out market volatility, think about which return series to use.
Choose log returns for symmetry and better aggregation, or simple returns when you need easy-to-understand percent changes. Be clear about whether to include or exclude overnight returns, as they greatly affect your variance budget. High-frequency returns, like 5-minute returns, capture intraday risk but add microstructure noise. On the other hand, lower frequency returns, such as daily closes, smooth out this noise but may lag during sudden changes in market regime. Discretionary scalpers and systematic intraday teams often overlook the impact of overnight gaps, leading to stop placements that get caught up in the real noise they face.
How do you compute realized volatility from intraday ticks or bars?
First, gather the returns at the chosen bar size, r_i. Next, calculate the total of the squared returns using the formula RV = sum(r_i^2). To annualize, multiply by the trading period factor; for example, use daily RV times 252 for annualized variance, and then take the square root to get annualized volatility. For instance, if you have 78 five-minute returns per day, add their squares over a week and divide by the number of days to find daily variance. Finally, annualize by multiplying by 252. This method gives you an empirical, market-native figure that accurately shows the true price churn faced when making trades.
When should you use range-based estimators instead of return squared sums?
When feeds are sparse or when we want to be more efficient each day, Parkinson or Garman-Klass estimators should be used. These estimators take variance from high, low, open, and close prices without needing many intraday ticks. They effectively lower sampling error, especially for assets that trade in narrow windows. However, they assume no drift and no overnight jumps, which means they can fail when gaps occur. So, it is essential to think of them as lower-variance, higher-bias tools, using them when data quality limits how precise realized variance can be.
Which models produce sound short-term forecasts?
For responsiveness, use an Exponentially Weighted Moving Average (EWMA) where the new variance is a weighted mix of yesterday’s variance and today’s squared return. Choose a decay factor that fits your time frame; for example, use a lambda of about 0.94 for daily responsiveness. To address conditional heteroskedasticity and volatility clustering, estimate a GARCH(1,1) model with parameters estimated by maximum likelihood. This model adjusts for both persistence and mean reversion in realized variance. Choose EWMA when you want simplicity and low calibration overhead, while GARCH is better when you need a parameterized, forecastable variance term structure for risk budgeting.
How do sampling choices and overlapping returns bias estimates?
Longer-horizon returns derived from overlapping samples inflate serial correlation and bias apparent persistence. In contrast, nonoverlapping returns reduce sample size and increase estimator variance. It is advisable to use nonoverlapping windows for clean tests. Additionally, applying degrees-of-freedom corrections for small samples, such as using the sample variance with n-1, can help avoid underestimating accurate dispersion. This trade-off is significant. For instance, if position sizing is optimized based on overlapping monthly returns, it may lead to overfitting persistence and insufficient preparation for sudden spikes.
How do you translate volatility into position sizing and stop placement?
Map your acceptable dollar risk to how much you expect the price to move, and size your positions smaller when volatility is high. If your goal is a steady 6 percent objective for each evaluation, adjust your positions so that a move of one standard deviation matches your risk tolerance. Traders who set their position sizes to fixed dollar amounts without adjusting for volatility often end up with a higher risk when volatility increases. This can cause significant losses during turbulent periods and lead to reacting rather than sticking to a disciplined plan.
Why is it essential to put volatility in context?
To make variance more useful, present it as likely ranges or percentiles rather than just abstract numbers. This process turns risk into a rule that can be traded. For example, Volity explains relative risk: "A stock that moves 5% annually is less risky than one fluctuating 30%." — Volity, 2023-10-01. When you map volatility to possible outcomes for planning stops and targets, it's essential to understand how to interpret these ranges. For instance, Volity notes, "A stock with 5% annual volatility and a 7% average return would likely see returns between -3% and 17% about 95% of the time."
What common mistakes change a correct calculation into a false comfort?
Common mistakes include stale parameters, ignoring microstructure when using high-frequency data, and treating implied volatility as equivalent to realized volatility. This issue is seen in both discretionary and systematic traders. For example, traders often set stops based on a historical ATR number that stays frozen for weeks. Then, they wake up to find that volatility has doubled, which makes the stop, meant to protect the account, instead empty it. This emotional burden is heavy; traders feel stuck when their rules no longer align with reality. A simple fix is to reestimate with a conservative bias regularly.
How to think like an execution engineer?
Calibrate your estimator to match the activities you can perform. If fills and slippage are substantial, simulate the volatility estimate using your execution algorithms. Focus on actual trading volatility, as it is what matters, not just the theoretical number.
Think of volatility like the lane width while driving in the rain; be ready to adjust your speed and distance. Use the same careful margin when sizing your trades and setting your stops.
How does volatility mismatch affect trading?
The last mismatch is not just a mathematical error; it reflects a human mistake that significantly affects trading strategies.
Related Reading
- Basic Trading Strategy
- Spot Algorithmic Trading
- Forex Trading Profit Per Day
- Crypto Trading Bot Strategies
- Best Forex Trading Bots
- Fair Value Gap Trading Strategy
- Best Leading Indicators for Day Trading
- Best Indicators for Swing Trading
- Best Charting Software for Day Trading
- Best Indicators for Options Trading
How to Trade Volatility Like a Pro
Treat volatility trading like running a fast-response crew, not like a lone gambler. Set clear rules for your strategy, practice your entries and exits, and size every position to the amount of money you can afford to lose. You will become skilled by repeating a disciplined process until your reactions become automatic rather than based on emotions.
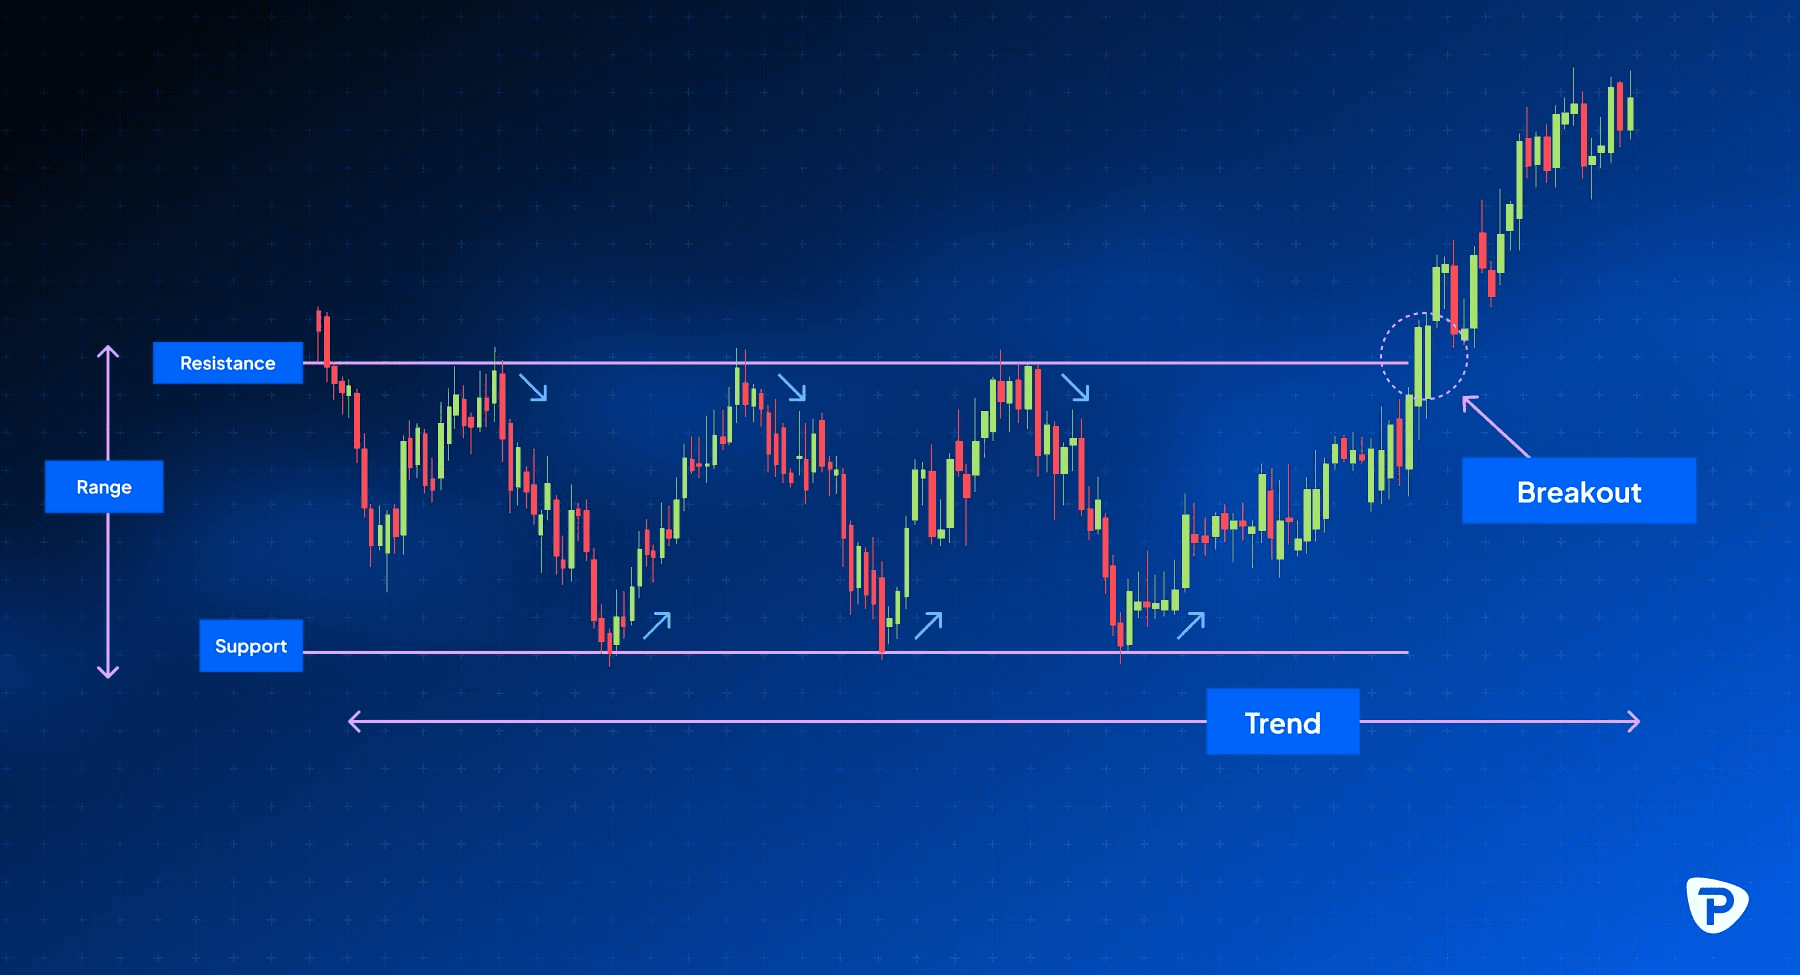
How should you classify volatility so your rules actually trigger?
To effectively classify volatility so your rules work correctly, divide regimes into practical categories: news spikes that are short-lived, breaks in multi-day trends, structural liquidity squeezes, and correlation storms. For each category, track different signals like option skew and open interest to see how stressed dealers are, and check order-book depth to find out if a single trade will really move the price. This method allows you to quickly change your strategy, as the way you handle a day-trending squeeze is different from how you handle a one-time headline spike.
How do you manage the whole trade, not just the entry?
Think of a trade as having four stages: plan, execute, defend, and review. Before you start, plan the trade by deciding the size, staggered entry points, and hard stops at predetermined stress levels. Set a timeline for rebalancing if the trade goes against you. While holding the position, only use pre-authorized adjustments. For example, use a single scheduled hedge or a laddered partial exit, which helps reduce stress in decision-making. After the trade, write down the fills, slippage, and the exact conditional logic you used. Then, do a short replay to see which rules worked and which ones didn’t. This practice changes lucky wins into a repeatable edge.
What do you do when cross-asset volatility rises unexpectedly?
Treat correlation shifts as a separate risk factor and include them in position sizing before adding exposure. Identify the few assets that most significantly affect your portfolio and set hard exposure caps between them. When correlations spike, these caps help in liquidating positions in a controlled way instead of depending on margin calls to decide which legs to liquidate. Professionals are increasingly watching volatility benchmarks as tactical inputs because these indicators offer a quick reference for when to use these caps. As noted by EdgeClear, "over 50% of professional traders incorporate volatility indices in their trading strategies.", this trend shows how useful an objective gauge can be during stressful times.
How should you scale your capital effectively?
Most people scale by using personal capital, increasing their size when they feel confident. This approach feels natural and low-friction. However, it becomes problematic during periods of outsized market moves. Such scenarios can lead traders to make poor leverage decisions, increase execution risk, and fragment performance. Platforms like funded accounts for futures trading provide instant, scalable capital and simulate runways. This enables traders to rehearse their exact sizing and stop logic at an absolute scale without jeopardizing personal funds, ultimately preserving discipline when faced with market challenges.
How do you grow an edge without blowing it up?
Use volatility targeting to set position limits that adjust with the market conditions. Tie growth to consistency instead of one-time wins. This approach is essential because volatility periods offer both chances and risks. Studies show that careful volatility strategies can improve returns during periods of high volatility. As EdgeClear notes, "Traders who use volatility strategies can see returns increase by up to 30% during high volatility periods." To turn this potential into practical rules: limit exposure to a percentage of equity for each market condition, require a set number of profitable periods before increasing risk, and set up automated drawdown rules to ensure that reducing risk is a planned action rather than a response to fear.
What did the simulation with funded traders reveal?
A two-week simulated program with funded traders showed a clear pattern: traders who practiced their trade lifecycle with realistic fills and scaled capital made fewer impulsive changes during real spikes. The muscle memory from the practice took over, leading to a significant change in behavior. This change, even without modifying the system, reduced early stops and improved follow-through consistency.
What is the most surprising challenge in trading?
The most surprising challenge happens when your rules work perfectly, but human reactions get in the way. What comes next is where the real test begins.
Best Volatility Trading Strategies For Success
Volatility trading should be seen as a set of helpful strategies, each chosen for a specific situation, timing, and risk level. The best strategies combine an indicator-driven entry, defined-risk setups, and careful sizing that matches your 6 percent goals. By including term-structure plays, skew and dispersion trades, and event straddles with clear, planned rules for entries, hedges, and exits, traders can make sure that their performance is repeatable instead of just depending on luck.
Which strategies work best when volatility goes up?
Pay attention to the difference between implied and realized volatility, not just the news headlines. When implied volatility is much higher than realized volatility, short-dated calendar spreads or selling some vega can help collect premium with limited risk. On the other hand, when implied volatility is low compared to realized volatility, buying variance or long-dated calls gives you asymmetric chances. Use skew to your benefit: risk reversals let you show your directional view while taking advantage of skew when dealers charge more for downside protection. Treat each strategy as a probability-weighted bet, sizing your positions so that a 1 standard deviation move fits within your loss limit, and spreading out entries across expiries helps to ease roll costs.
How should you time entries and confirm moves?
Use indicators as decision anchors, not just decoration. According to the XS Blog, "75% of traders use volatility indicators to enhance their trading strategies." This shows that using indicators is important for trading decisions. However, many traders make mistakes by relying on them alone. After working with volatility traders in different programs, a clear pattern showed up: entering breakouts without checking for volume confirmation or order-book depth can lead to many false starts and emotional stop-outs. It's important to wait for volume to confirm a Bollinger squeeze breakout and to watch for changes in open interest before selling premium. Spread out your fills so that slippage doesn’t hurt your advantage.
Which trade structures protect capital while leaving upside?
Favor defined-risk builds when you can't rebalance all the time. Options like debit butterflies, capped-call ladders, and small-size calendars can work well. Use variance swaps or long-volatility ETNs when you want pure exposure without delta noise. For directional opportunities, pair a less expensive long-dated option with a nearer-term short to finance exposure while keeping your worst-case loss limited. Disciplined, rule-based hedging makes a high-volatility environment easier to handle. This approach, if used consistently in volatile markets, can lead to significant performance improvements, as the XS Blog suggests: "Volatility trading strategies can increase returns by up to 30% in volatile markets."
What breaks when you scale these tactics?
Most traders scale up by increasing notional when they feel confident. This method focuses on risk and increases the chances of execution problems. The main issue stems from complexity without automation; traders often perform manual rebalancing when the market changes and misinterpret spikes in correlation between assets. Treat cross-asset exposure as an essential limit: cap correlated holdings, define emergency deleveraging triggers in advance, and set aside margin for the most likely worst-case intraday repricing. Think of it like traffic control; time entries to move with liquidity, not against it.
What’s the hidden cost of familiar tactics?
Most traders rely on personal capital and manual hedging because it is familiar and does not require new systems. This approach works until volatility reduces decision time, fills deteriorate, and a missed hedge greatly increases losses. Platforms like funded accounts for futures trading provide an alternative path. They offer instant funding of up to $450K, simulated capital with real rewards, a profit split of up to 100 percent, fast weekly payouts, and 24/7 support, which can significantly enhance your trading strategy This enables traders to practice scaled execution against realistic fills and keep their discipline when markets challenge them.
How do you convert these tactics into a repeatable workflow?
Make every trade a checkbox process that includes: signal source, liquidity test, size table matched to volatility, hedge plan, and scheduled review. Automate tasks where you can, like alerts for term-structure divergence, conditional orders connected to order-book depth, and real-time slippage logging. In a 90-day coaching cycle with a small group, traders who used a scripted checklist, including required volume confirmation and preassigned hedges, reduced reactive exits and improved the clean-win-to-whipsaw ratio. Build the habit of reviewing fills and decisions in the same week they occur, treating the review as an engineering step rather than a therapeutic process.
What is a practical analogy for volatility trading?
Volatility trading is like running a control room instead of chasing fireworks. You set up sensors and decide how to react. Then, you let the system do its job while you keep an eye out for any exceptions.
Unlock up to 50% off Your First Funded Account for Futures Trading.
If you want to turn disciplined volatility workflows into funded execution, I recommend AquaFutures so your vega and gamma strategies can scale beyond a small personal bankroll. You understand the hard work of position sizing, timing your trades, managing implied and realized volatility, and controlling slippage. Choose a partner that sees volatility trading as a control room and take the next practical step toward trading with repeatable, capital-backed discipline. Check out funded accounts for futures trading for more information.
Related Reading
- Fibonacci Trading Strategy
- Best Prop Trading Firms
- ORB Trading Strategy
- Crypto Swing Trading Strategy
- Best Copy Trading Platform
- Best Proprietary Trading Firms for Beginners
- Best Stocks for Options Trading
- Silver Bullet Trading Strategy
- Order Block Trading Strategy
- The Strat Trading Strategy
- Supply and Demand Trading Strategy
- Profitable Gold Trading Strategy
- Higher High Lower Low Trading Strategy
