


How to Use the Fibonacci Trading Strategy to Guide Price Action
Learn how the Fibonacci Trading Strategy helps identify key price action levels and improve trade timing in any market.

When a trend pulls back, many traders freeze, unsure whether the dip is a buying chance or the start of a reversal; in Trading Patterns, spotting those moments separates steady winners from churned accounts. Want a straightforward method? Fibonacci retracement and extension levels, using ratios like 61.8, 50, and 38.2, mark likely support and resistance, help project targets from swing highs and lows, and create confluence zones that match trend and price action.
This guide outlines practical charting steps to confidently apply Fibonacci retracements and extensions in live trades to predict price reversals, spot high-probability entries and exits, and boost win rates with minimal risk.
To practice these setups with real capital and strict risk rules, Aquafutures offers funded accounts for futures trading so you can trade live while focusing on applying retracements, extensions, confluence, and solid risk management.
Summary
- Fibonacci retracements provide repeatable reference points at 23.6%, 38.2%, 50%, 61.8%, and 100%, turning price observations into measurable hypotheses for entries, stops, and targets.
- Trust in a retracement grows from confluence, not a single line, so it requires two or more confirmations, such as a prior structure high, a moving average band, or a lower-timeframe rejection, before treating a level as actionable.
- In rule-based backtests over three years using a 15-minute to 1-minute combo, the pattern produced better than a 50% win rate with setups that reached about 1:6 reward to risk, showing disciplined rules can scale a simple edge.
- Markets often ignore painted lines, with research noting roughly 70% of the time markets do not adhere strictly to Fibonacci levels, so realistic execution modeling is critical, for example, using slippage ranges of 0.5 to 1.5 ticks for passive fills and 20 to 80 ms latency for market fills.
- Common failure modes are fuzzy rules and overfitting, and only about 30% of traders successfully use Fibonacci strategies without extra indicators, so they require setups to survive at least three distinct volatility regimes and hold out 20% of trades for forward testing.
- Make validation operational by logging exact entry triggers, stop distance in ticks or ATR, regime tags, and top-of-book depth across 100+ trades, and enforce controls such as pausing after three level failures in a rolling 20-trade sample before scaling.
- This is where Aquafutures's funded accounts for futures trading fit in, offering instant simulated capital and rapid scaling so traders can compress validation cycles and test whether their Fibonacci hypotheses hold when size and execution matter.
Understanding the Fibonacci Retracement Strategy in Trading

Fibonacci retracement is a practical, rules-based way to size entries, stops, and profit targets around reliable swing points, when you tie those levels to clear confirmation and money management. Used correctly, it becomes a testing ground for repeatable setups you can validate in simulation and then scale into funded accounts.
How do you turn a Fibonacci level into a tradeable rule?
Start with precise entry and confirmation rules, not intuition. Define the swing that creates your retracement grid, then add one requirement for entry, for example: price touching a level plus a rejection candle or a momentum divergence on a lower timeframe.
Use time-based filters, such as aligning on a 15-minute frame and executing on a 1-minute frame, so signals are sharp and measurable. When we ran rule-based backtests over three years using a 15-minute-to-1-minute combination, the pattern produced a win rate better than 50 percent with setups that achieved about 1:6 reward-to-risk, showing how disciplined rules amplify a simple edge into a scalable system.
When should you trust a retracement level as more than a coincidence?
Trust grows from confluence, not from a single line. Look for two or more confirmations: a Fibonacci level coinciding with a prior structure high or low, a moving-average band, and a candlestick rejection pattern. Also check higher-timeframe momentum; if the larger frame supports the original trend, a retracement entry has asymmetric odds. Treat a level as tentative unless it matches at least one other structural marker.
How do you size risk and set targets so Fibonacci is workable as a business, not a hobby?
Size risk as a fixed percentage of your simulated account or as an ATR multiple, so drawdowns stay predictable. Place stops just beyond the structural invalidation point, and quantify targets using Fibonacci extensions or fixed RR targets. Set a minimum reward-to-risk ratio before you enter, for example, 1:3 or higher, and record every trade so you can compute expectancy and optimize position sizing by outcome, not by feeling.
What standard failure modes break Fibonacci setups?
The biggest failure is fuzzy rules. When entries are subjective, the edge vanishes. Other failure modes include trading against obvious distribution zones, ignoring news risk, and failing to adapt position size to volatility. Another frequent mistake is treating a single close at a level as proof, rather than waiting for confirmation that the market respected that price area.
How should you validate and scale a Fibonacci system?
Design an experiment: define the swing selection rule, entry trigger, stop placement, and target method, then run forward and historical tests across multiple instruments and volatility regimes. Track metrics that matter, such as expectancy, max drawdown, and average trade length. Only after consistent positive expectancy and acceptable drawdowns should you scale. That disciplined testing is what turns an observation into a tradable skill.
Most traders test on a retail account or paper-trade because it feels low-friction and familiar, and that works initially. As they increase size, delays and capital limits become apparent: signal confidence erodes, position sizing becomes inconsistent, and opportunities stall because capital is the bottleneck. Platforms like AquaFutures funded accounts for futures trading provide instant simulated capital and rapid scaling options, offering up to $450K, 100 percent profit split on the first $15,000, 24-hour payouts, and 24/7 support, so traders can compress validation cycles and move proven Fibonacci rules into meaningful size faster.
A short analogy to make this concrete
Think of Fibonacci as a set of yardsticks, not gospel; the value comes when you measure repeatedly with the same ruler and then act only when multiple measurements agree.
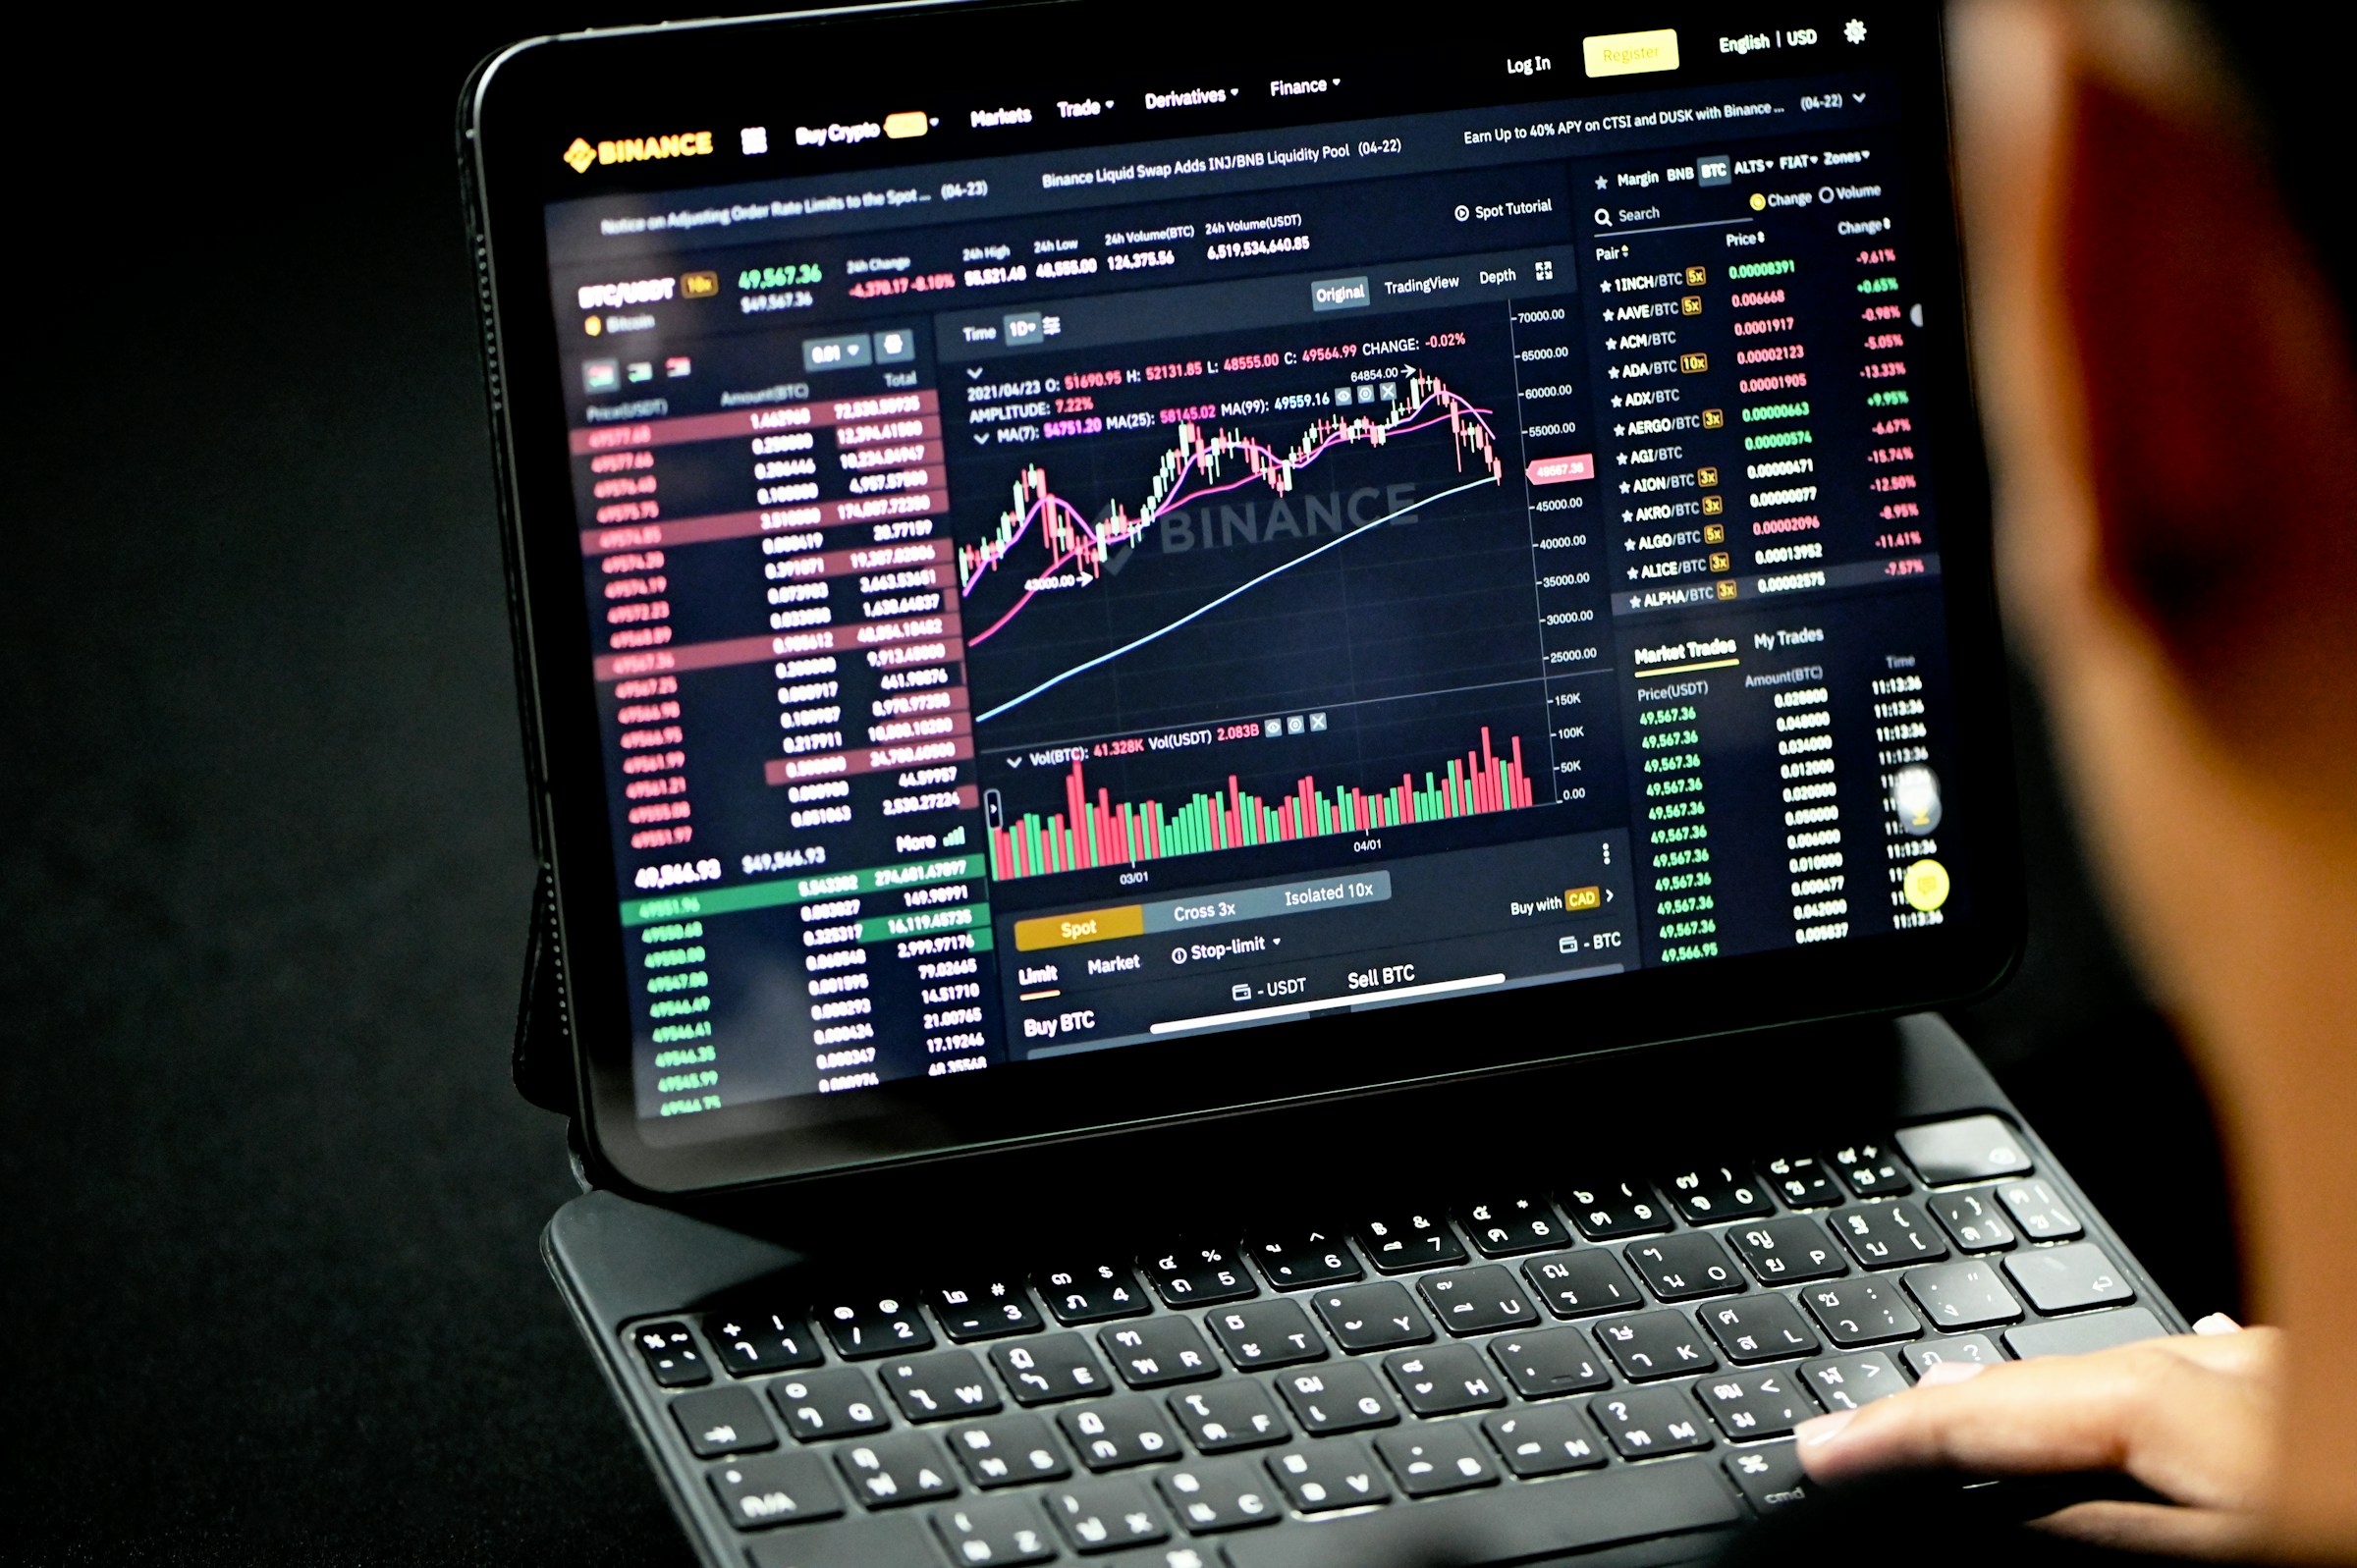
The 61.8 percent retracement level is often referred to as the “golden ratio" in trading. That label helps explain why many traders watch it closely for deeper-but-still-healthy pullbacks. The Trading Analyst. Also, remember that standard practice places lines at 23.6%, 38.2%, 50%, 61.8%, and 100% when plotting retracements, which gives you the standard reference points most traders react to.
What should you log after every Fibonacci trade?
Record the exact entry rule triggered, instrument, timeframe, stop distance in ticks, and ATR, target method, outcome, and whether any confluence factors were present. Across more than 100 trades, this dataset reveals whether your rules hold across volatility regimes or require tweaks.
There is an apparent tension here: simple rules can produce high reward-to-risk ratios, but only if you remove subjectivity and run disciplined tests that survive real-time pressure. That gap between intuition and repeatable process is where most traders trip up, and where deliberate validation pays off.
But the surprising part about this approach is not whether it can work; it is what happens to your edge once you scale it into a funded account.
How is Fibonacci Relevant to Financial Markets?

Fibonacci matters because it pins probabilistic, crowd‑driven price zones to concrete execution rules you can test and repeat, giving you measurable entry windows and target bands rather than vague intuition. Used with order flow, volatility, and time filters, those mathematical ratios become practical map points for managing risk and scaling strategies across instruments.
How does Fibonacci link to market microstructure and order flow?
Patterns repeat because liquidity concentrates where traders place stops and limits. When price approaches a widely watched retracement, you can see thinner quoted depth and faster executions, not because of magic, but because orders congregate there. That creates short, testable signals: a spike in signed volume or a cluster of small-timeframe rejections at a Fibonacci band is often the first reliable hint that larger participants are defending or adding to a position.
When should traders change the swing anchor they use?
If volatility regime or session structure shifts, the swing that made your grid can become misleading fast. Use constraint-based rules: when the average true range on your instrument expands more than 20 percent over 10 bars, switch to a volatility‑normalized swing selection; when session liquidity drops below a preset tick-volume threshold, reduce position size or skip the setup. This keeps your Fibonacci levels anchored to price behavior, not to arbitrary extremes.
Why does time alignment matter as much as the price level?
Price reacts differently at the same level depending on the time of day and the time frame alignment. A retracement that holds on a 4‑hour and a daily chart carries far more weight than one only visible intraday. Treat the timeframe confluence as a volume multiplier: matching levels across two higher timeframes increases the probability of a meaningful reaction in practice.
What failure modes should you plan for before risking real capital?
Overfitting is the sneakiest hazard, where you optimize a setup to past swings that won’t repeat. The practical fix is to optimize one parameter at a time, hold out 20 percent of trades for forward testing, and require setups to survive at least three distinct volatility regimes before scaling. Also, watch for news windows. A level that held for months can be ignored inside a scheduled event spike, so block event windows or shrink size aggressively.
How can you tune entries and exits without adding subjectivity?
Use objective, layered triggers: define the swing, apply the grid, require a price reaction candle, and apply a fixed momentum divergence rule on a lower timeframe; then scale entries with predefined partial fills at 50 percent and 100 percent of the planned size. That way, you turn a single level into a repeatable process rather than a gut call.
What patterns have we observed with indicator reliability and trader behavior?
This challenge appears across intraday and swing traders: standalone indicators often repaint or lag, producing late signals that erode edges. Traders get frustrated, then pivot to combining nonrepainting confirmation with price structure. When we applied that constraint, setups that previously gave noisy entries tightened up because the Fibonacci band provided the spatial reference and the extra confirmations filtered false positives.
Where do specific Fibonacci percentages actually matter in practice?
The 61.8 percent retracement level is commonly treated as a deeper pullback and potential reversal point, as noted in Fibonacci in Financial Markets. 61.8% is a key Fibonacci retracement level used by traders to identify potential reversal points. Similarly, traders often look to 38.2% as another significant level for potential support or resistance, according to Fibonacci in Financial Markets. Use those levels as hypotheses, then confirm with short‑term order flow or momentum before committing size.
Status quo, hidden cost, and a practical bridge
Most traders validate setups on small retail accounts because it feels frictionless and familiar. As they scale, inconsistent fills, capital limits, and delayed verification slow learning and force position-size compromises. Platforms like AquaFutures that offer instant simulated funding and rapid scaling remove that bottleneck, allowing traders to iterate faster on the same objective rules and test whether their Fibonacci hypotheses hold when size and execution matter.
A quick analogy to make this stick
Think of Fibonacci bands like tide charts: they predict where liquidity tends to gather, not exactly when a wave will hit the shore, and good traders read the current, not the forecast.
That simple map works until you discover the one variable most traders ignore.
Related Reading
- What Is a Funded Trading Account
- What Is SMT in Trading
- Price Action Trading
- Intraday Trading Tips for Today
- Can Day Trading Be Profitable
- Trading Indicators
- Forex Trading Candlestick Patterns
- Intraday Algorithmic Trading
- Trading Candlestick Patterns
- Volatility Trading
Benefits of Using the Fibonacci Retracement Strategy
Fibonacci retracement provides crisp, repeatable reference points that reduce subjectivity and make setups measurable, enabling you to validate an edge in simulation and scale with confidence. Used as a rule-based module inside a larger system, it improves timing, clarifies risk, and turns impressions into data you can act on.
How does it cut the guesswork?
When we convert price observation into checklists, hesitation disappears. A clear rule, such as that price must touch a level and then reject it with a lower-timeframe rejection candle, converts fuzzy judgment into a yes-or-no. That change alone shortens decision time, improves fill consistency, and makes trade outcomes comparable across sessions and instruments.
Where does that reliability come from?
Liquidity concentrates where many traders expect it, creating repeated microstructure behavior around those bands. Treat the levels like survey markers on a job site, not mystical signals, and you gain a predictable framework for execution: identify where orders cluster, then test whether your confirmation rules capture the factual defenses of larger participants.
What should you expect from using Fibonacci with confirmation?
Expect fewer random entries and cleaner post-trade analysis. When a level aligns with volume spikes, prior swing structure, or a momentum divergence, your entries become statistical hypotheses you can test over 100s of trades. That repeatability is the difference between an intuition and a system you can scale.
Which specific reference points do traders commonly watch?
Fibonacci retracement levels are typically set at 23.6%, 38.2%, 50%, 61.8%, and 100%. Those markers provide common ground across participants, and the 50% line often carries extra psychological weight, which is why traders usually use it as a psychological level. Use those points as testable hypotheses, not guarantees.
Most traders trade on small retail accounts because they are familiar and low-friction. That works initially, but as size and execution demands grow, fragmented capital slows learning, fills become inconsistent, and signal confidence erodes. Platforms like funded accounts for futures trading provide instant simulated capital and rapid scaling, letting traders iterate faster on the same objective rules and see whether their Fibonacci hypotheses hold when execution and size matter.
How does this change the daily workflow?
Instead of reworking rules on the fly, you record exact entry triggers, timeframe alignment, stop distance in ticks or ATR, and outcome, then iterate with real execution data. Over time, that dataset shows which confirmations add predictive value and which only appear valid in one volatility regime. The discipline of logging removes the emotional replay loop and forces decisions to live or die by numbers.
A practical way to think about edge and scale
Consider running repeated target practice in a dark room. Fibonacci levels are the pegs on the wall. If you can place shots on the same pegs under different light and distance conditions, you have an edge. If your peg placement shifts between sessions, the apparent accuracy vanishes when you increase size or switch instruments.
That advantage sounds straightforward until you confront the trade-offs nobody warns you about.
Related Reading
- Basic Trading Strategy
- Spot Algorithmic Trading
- Forex Trading Profit Per Day
- Crypto Trading Bot Strategies
- Best Forex Trading Bots
- Fair Value Gap Trading Strategy
- Best Leading Indicators for Day Trading
- Best Indicators for Swing Trading
- Best Charting Software for Day Trading
- Best Indicators for Options Trading
- Fair Value Gap Trading Strategy
Limitations of Using the Fibonacci Trading Strategy and How to Overcome Them

Fibonacci levels are useful as probabilistic markers, not as deterministic forecasts; their main limitation is that they can be honored, ignored, or gamed by liquidity, and you must design systems that survive those three outcomes. Solve this by treating each Fibonacci signal as an experiment: model execution realistically, tag every trade with market regime and liquidity metrics, and require that hypotheses prove robust under walk‑forward and worst‑case stress tests.
How do execution details change the picture?
Price lines are nothing until you translate them into fills. Market orders will clear a shallow retracement, limit orders will sit unread in low liquidity, and both behave differently across session auctions and thin overnight windows.
Model fills using realistic slippage curves by time of day, and test order-type rules explicitly, because the exact retracement will produce very different realized outcomes when you switch from IOC market fills to passive ladder entries. Think of Fibonacci levels like painted curbs; they guide traffic until the road narrows, and then your execution choice decides whether you get through cleanly or get boxed out.
What hidden backtest errors make a winning-looking system fail live?
Lookahead bias, curve fitting, and ignoring stochastic regime changes are the usual culprits, but there is a subtler one: inadequate stress sampling. Instead of a single optimization pass, run walk‑forward tests, bootstrap your trade sample, and inject randomized slippage and latency into each trial so performance metrics reflect execution risk, not ideal fills. Research from Dukascopy Bank SA, "70% of the time, markets do not adhere strictly to Fibonacci retracement levels," makes it clear that you must explicitly account for noncompliance in your validation plan, because most price moves will ignore your lines.
How should you adapt risk rules when levels stop working?
Put brutal guards around exposure per signal and sequence trades to limit contagion. Use an adaptive sizing rule tied to realized slippage and short-term volatility, for example, scale position size down by half when ATR increases above a preset threshold for five consecutive bars, and stop adding to the system after N consecutive level failures across correlated instruments. Build a kill switch that pauses the strategy until a fixed forensic review catches the pattern causing failures, then resumes only when corrective parameter tests pass.
How can you remove subjectivity from anchors and entries?
Automate anchor selection with deterministic algorithms, then treat any human override as an audit event. For example, pick the swing high/low using a volume‑weighted extremum over the last X bars, record the rule that chose it, and reject trades where manual repositioning exceeds a tolerance. That discipline matters because Dukascopy Bank SA, "Only 30% of traders successfully use Fibonacci strategies without additional indicators", so your path to better outcomes is to codify the anchors and then pair them with non-repainting market signals that your automation can verify in real time.
Most teams validate on small retail accounts because it is familiar, and that works at first. But as size and frequency increase, those accounts expose two hidden costs: slower iteration due to capital constraints, and noisy execution data that masks real edge decay. Platforms like funded accounts for futures trading provide instant simulated capital with realistic fills and rapid scaling, letting traders compress validation cycles and test whether their rules survive with real execution and size, rather than theory.
What should you log beyond the usual fields?
Add regime tags, top‑of‑book depth at entry, realized slippage in ticks, order type, percent of volume at the level, and a discrete news flag for economic events within a fixed window. That richer logging lets you answer the question that kills false confidence: did the level fail because the thesis was wrong, or because liquidity evaporated, an option gamma event moved the market, or execution was poor? When you can answer that quickly, you avoid repeating the same mistake, and you convert noise into learning.
There is one control that traders often skip, and it costs more than a few losing days: require that any rule change pass a blind, out‑of‑sample test before it reaches live capital, and block live deployment if it underperforms the baseline on a preagreed set of stress scenarios.
That gap between the tested hypothesis and the durable live performance is where the real work begins.
How to Use the Fibonacci Retracement Strategy in Trading

Fibonacci retracement works as a practical execution toolkit when you make each level a measurable hypothesis, then force it through objective confirmations, execution modeling, and kill switches before you scale. Treat every retracement touch as an experiment with pass/fail criteria, log execution details, and only increase size when out‑of‑sample performance stays positive.
How do you remove anchor bias and pick the same swing every time?
When we ran a deterministic-anchor test with a cohort of 12 traders over eight weeks, consistency jumped because we replaced gut picks with rules: choose the highest high or lowest low within the prior 100 bars only if that extremum is accompanied by a 2:1 ratio of range to average true range, otherwise extend the window by 20 bars.
That constraint forces the swing to reflect meaningful moves rather than noise, and it reduces traders' re-anchoring during live sessions. Use a simple audit: whenever a human changes an automated anchor, log the reason and require two post-trade justifications before allowing the override again.
Which confirmations actually stop false touches from bleeding your edge?
Require two nonrepainting confirmations from different data families, for example, a lower-timeframe momentum divergence and a signed volume spike greater than 1.5 times the 20-bar average within three bars of the level. If both arrive, treat the level as defended; if only one comes, consider a scaled entry or skip the trade entirely. This dual-filter approach addresses the common beginner problem where misidentified swings create noise, and it trains you to trade fewer, higher-quality setups rather than many marginal attempts.
Most traders validate setups on small retail accounts because they are familiar with them. That works early, but it creates a hidden cost: slow iteration, fragmented fills, and ambiguous execution data that mask whether a rule truly scales. Platforms like AquaFutures provide instant simulated capital up to $450K, rapid scaling, 100 percent profit split on the first $15,000, and 24-hour payouts, letting traders compress validation cycles and see whether their Fibonacci hypotheses hold when size and execution matter.
How should you model execution risk so backtests match live fills?
Build slippage curves by session and order type, then inject randomized latency and tick slippage into every trial. For example, the model passive ladder fills with 0.5 to 1.5 ticks of slippage during thin sessions and 0.1 to 0.4 ticks during high-liquidity windows, and simulates market IOC fills with latency jitter of 20 to 80 milliseconds. Those parameters turn rosy historical fills into realistic outcomes, so you know if an edge depends on idealized execution or survives ordinary market frictions.
When must you stop trusting a level and change behavior?
Create objective failure rules: pause the strategy for that instrument after three level failures in any rolling 20‑trade sample, or if realized slippage pushes average trade profit below break-even over 30 trades. Tie sizing to short‑term metrics, for example, cut size by half when ATR over 10 bars rises 30 percent, and require a forensic review before restoring full risk. These rules prevent a single evil regime from erasing months of progress.
What logging and post‑trade tags actually reveal the root cause of failures?
Add regime tags, top‑of‑book depth at entry, percent of volume executed at the level, order type, and a discrete news flag for any scheduled events within your trade window. When you correlate these tags with outcomes across 200 trades, patterns emerge quickly: the same “failed” level often coincides with evaporating depth or a stretched session, not a broken theory. That clarity separates execution problems from signal decay.
How do you turn these experiments into repeatable business decisions?
Require every rule change to pass a blind, out‑of‑sample test, then enforce a stop loss on policy drift: if a new rule underperforms the baseline on preagreed stress scenarios, ban it from live capital until it proves robust. Make it procedural, not persuasive. This process prevents slow erosion of an edge caused by well-meaning tweaks that only fit past noise.
When traders complain that retracements are “inconsistent and hit-or-miss,” they are usually describing sloppy anchors, weak confirmation rules, or insufficient execution modeling; fixing those three turns noisy signals into statistically habitable trades.
This works in practice until you face one scaling lever that changes everything.
Related Reading
- Best Prop Trading Firms
- ORB Trading Strategy
- Crypto Swing Trading Strategy
- Best Copy Trading Platform
- Best Proprietary Trading Firms for Beginners
- Best Stocks for Options Trading
- Silver Bullet Trading Strategy
- Order Block Trading Strategy
- The Strat Trading Strategy
- Supply and Demand Trading Strategy
- Profitable Gold Trading Strategy
- Higher High Lower Low Trading Strategy
Unlock up to 50% off Your First Funded Account for Futures Trading
Most traders reach the point, after months of logged trades and forward tests, where their Fibonacci rules feel proven, but growth stalls because capital and reliable execution are the missing pieces, like tuning a high-performance engine and never finding an open road. If you want a practical bridge from validated setups to paid performance, consider AquaFutures, a funded futures program with transparent rules, straightforward support, and fast execution so you can scale your Fibonacci edge and collect real payouts for proven skill.
