


Supply and Demand Trading Strategy Explained For Beginners
Supply and Demand Trading Strategy for beginners: master zone mapping, risk management, and scaling with actionable steps and AquaFutures funding insights.
Price charts can be challenging, with levels stalling, false breakouts erasing stops, and market movers always seeming one step ahead. Identifying trading patterns such as supply and demand zones helps reveal institutional order placements and liquidity concentrations. These insights explain why prices may reverse or continue to rise, transforming market uncertainty into actionable signals.
Robust strategies rely on reading order flow, understanding market structure, and applying disciplined risk management to pinpoint reliable entry and exit points. Effective techniques turn challenges into opportunities, enabling traders to set sensible stop-loss and take-profit levels. AquaFutures offers funded accounts for futures trading to help users apply these tools with real capital and confidence.
Summary
- Supply and demand zones act as institutional footprints; about 70% of traders use them to identify reversals, and applying zone-based rules can improve trading accuracy by up to 30%.
- Traders who prioritize zone conviction reduce hesitation and stick to their risk plans, aligning with findings that 75% of traders using supply and demand report consistent profits and an average annual ROI of 20%.
- Zone sizing should follow volatility, not guesswork. For example, setting fresh zones between 0.5 ATR and 1.5 ATR keeps stops logical and limits predictable stop-hunt placement.
- Scaling breaks many traders due to limited capital and poor execution metrics, a problem reflected in industry data showing that about 90% of traders fail within the first year.
- Turn mapping into data by logging five fields per zone and using a three-tier grading system, since quantifying age, retests, ATR, and fills reveals which zones deliver repeatable expectancy.
- Treat execution metrics as core rules, continuously tracking first-limit fill rate, average slippage, and time-to-fill, and stress-test your plan so you maintain, for example, an 80% chance of hitting funding targets under adverse slippage.
- This is where Aquafutures's funded accounts for futures trading fit in, providing simulated capital and evaluation conditions so traders can practice staggered sizing, measure first-limit fill rates, and validate slippage assumptions under realistic fills.
What is the Supply and Demand Trading Strategy, and How Does It Work?

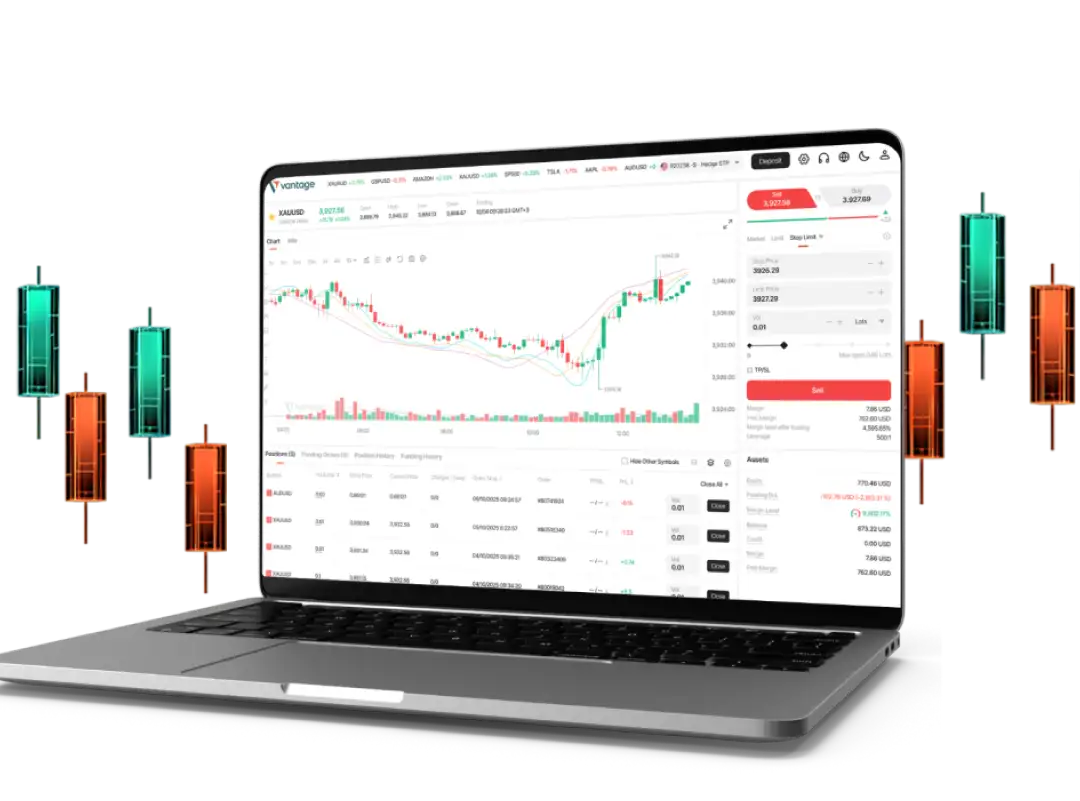
Supply-and-demand trading is a price-action-first strategy that turns recognizable imbalances into regular trading opportunities. This helps traders create high-probability entries along with careful risk management and clear execution plans. By viewing zones as indicators of institutional order flow, the process shifts from guessing to turning patterns into steady, cashable outcomes. If you're interested in capitalizing on these opportunities, consider exploring our funded accounts for futures trading.
Why does this approach actually give you an advantage?
This method makes you trade where real liquidity exists, not just where an indicator shows later. Approximately 70% of traders use supply and demand zones to identify potential market reversals — XS Blog, which explains why so many traders rely on them for timing. Since zones show unresolved order imbalances, they provide setups with greater potential. Additionally, Supply and demand trading strategies can improve trading accuracy by up to 30% — XS Blog, which is a practical advantage when you follow rules consistently instead of guessing where to enter.
What do traders actually want from these setups?
This pattern appears in day trading and funded-account applications: traders focus on setups that provide a comprehensive view of order flow and supply-and-demand context. This strong belief reduces hesitation when entering trades and helps traders adhere to their risk plans. This psychological clarity is more important than a small change in indicators; it ultimately changes how traders act, leading to better results.
How should you time entries and place stops?
Use higher timeframes to define major zones. Then, tighten entries on lower timeframes where execution liquidity and false-break noise are visible. Favor limit entries at the edge of a zone, placing stops beyond the structural base to avoid being stopped out by normal market noise. Size positions according to the distance between your entry and stop, rather than a fixed dollar amount. For those using funded accounts for futures trading, it can be beneficial to explore different strategies that leverage these accounts effectively. Reduce the size after seeing repeated tests of a zone, as the imbalance decays with each fill.
What breaks this method when traders try to scale?
Most traders start with small personal capital because it is simple and familiar. This approach creates real limits, such as psychological pressure to overtrade, limited margin to hold larger position sizes, and an inability to turn repeatable setups into significant payouts. Solutions like AquaFutures offer instant, simulated funding up to $450K with no activation fees, achievable 6% targets, a 100% profit split on the first $15,000, and quick payouts. This helps traders stick to disciplined risk while increasing entries that have been shown to be repeatable under evaluation conditions.
How do you defend against stop-hunts and false breaks?
Expect sudden changes and disorganized movement around clear areas, especially during major events. It's important to wait for the price to pull back into the area, followed by a clear direction candle, and for volume to confirm before going in fully. If an area is broken through by continued movement, remove it from your map. Uncompleted orders have likely expired, and sticking to that area can turn confidence into stubbornness.
What execution habits separate consistent winners from the rest?
Winners automate routine checks and keep accurate records of each zone test. They view trade management as the primary responsibility, not just entry. It's important to track hit rate and expectancy by zone type and timeframe, and adjust as needed. Some zones require quick partial-profit rules, while others require allowing winners to keep going. The discipline to follow a simple, repeatable set of rules will often outperform more complex tweaks that become hard to follow under stress.
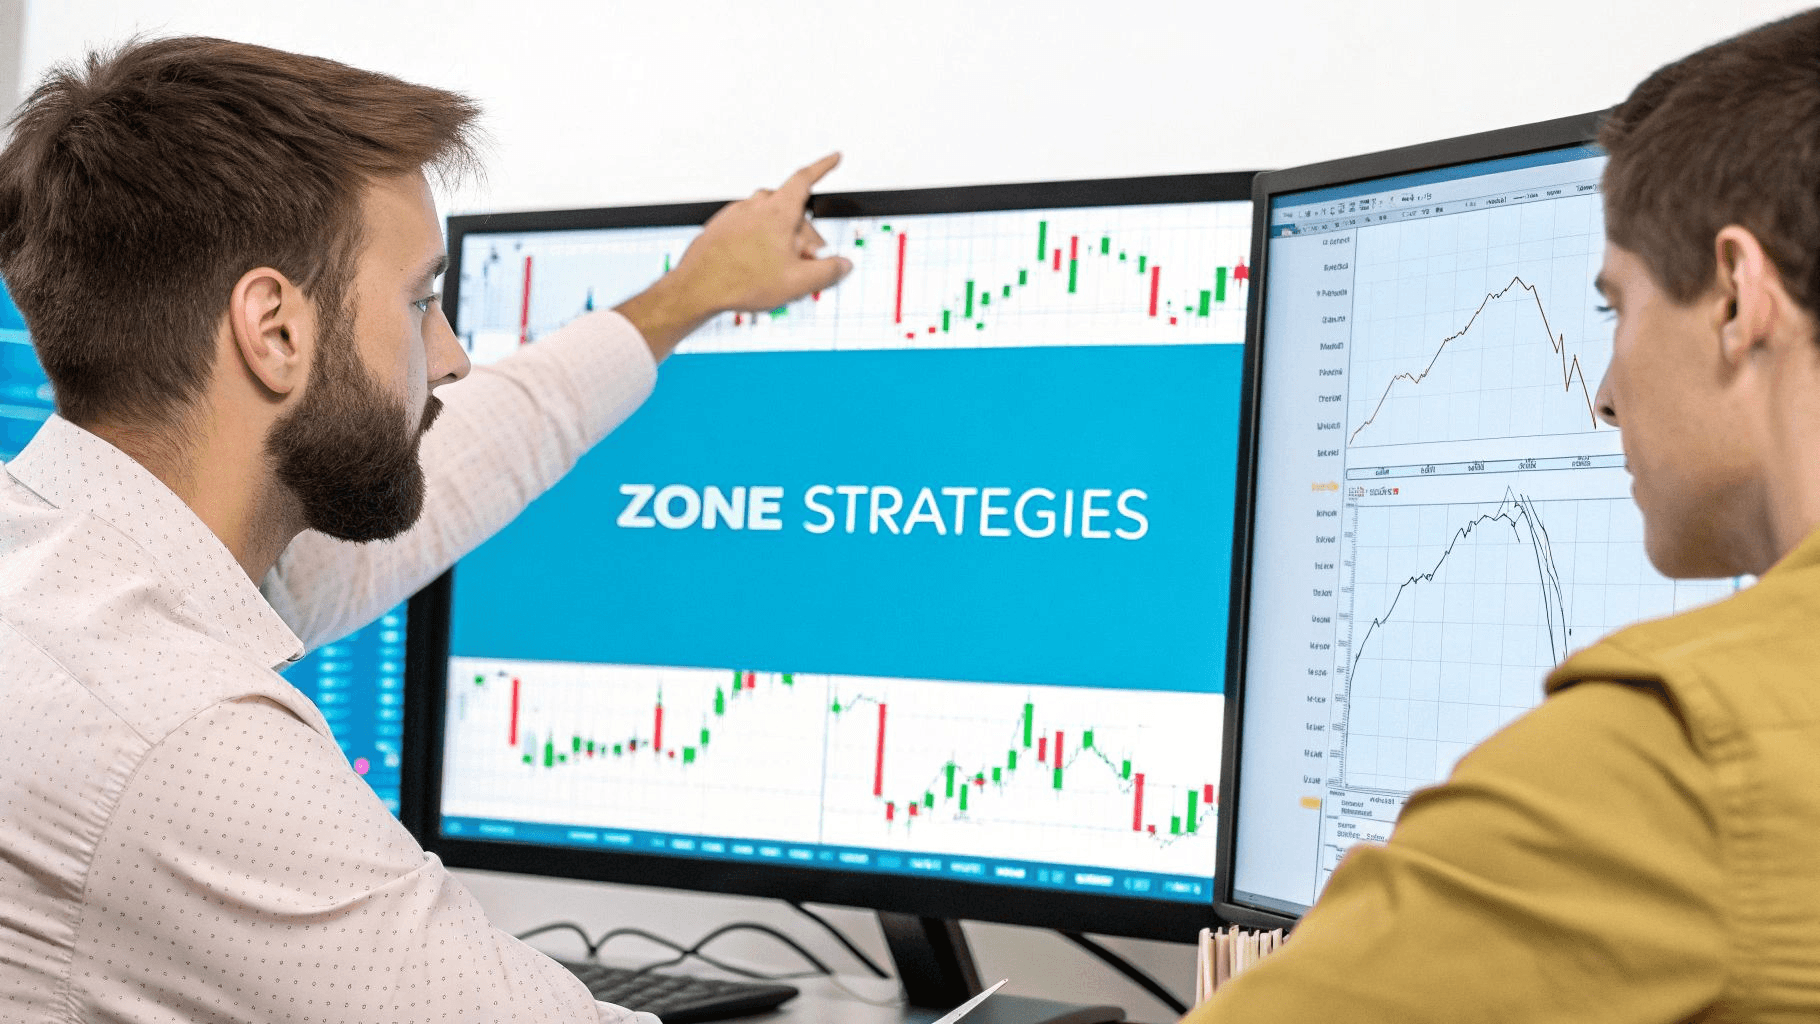
How can we visualize these trading strategies?
A short, vivid image to keep this practical: view zones as a set of footprints on wet concrete. They tell you who passed by and roughly how many. However, you still need the right shoes and timing to walk the same path profitably.
What is the key skill that traders need?
While confidence is valuable, the next skill is where most traders struggle. This is where the real separation happens.
Related Reading
- What Is a Funded Trading Account
- What Is SMT in Trading
- Price Action Trading
- Intraday Trading Tips for Today
- Can Day Trading Be Profitable
- Trading Indicators
- Forex Trading Candlestick Patterns
- Intraday Algorithmic Trading
- Trading Candlestick Patterns
- Volatility Trading
How to Draw Demand Zones

Drawing demand zones the right way means looking at two main things: how much buying interest is still out there and how strong that buying interest is as prices change over time. Use volatility to size the zone, score each revisit fairly, and trade with staggered entries. This way, a single wick does not turn a good setup into a blown stop.
How wide should my zone be on the chart?
When deciding how wide your zone should be on the chart, consider zone width relative to recent volatility rather than picking a random number. Measure the average true range on the timeframe you use. Then, create new zones between half and one and a half ATR, tightening the range as volatility decreases. This method helps keep your stop placement logical: wide enough to handle normal price movement but tight enough to keep a reasonable reward-to-risk ratio.
When traders treat zones as exact lines, they often place stops in predictable places, making themselves easy targets. I worked with a group of traders who adjusted their zones to match ATR, which led to smoother entries because the rules reduced emotional sizing changes during trades. If you're looking for a way to enhance your trading experience, consider our funded accounts for futures trading, which provide the necessary capital to implement your strategies effectively.
What practical checklist tells me a zone is worth trading?
Follow a short, easy checklist each time the price comes back. Think about the age, how many times it has retested, how it lines up with higher-timeframe structure, how close it is to liquidity, like swing highs or lows, and whether momentum shows a rejection. To keep things consistent, review PriceActionNinja (2025) and its "5 steps to identify" as a guide to turning price action into a repeatable decision-making process. This checklist helps turn judgment into action and cuts down hesitation at the edge of a zone. Score each item and ensure a minimum score before proceeding to full size.
How do I classify and prioritize multiple zones on the same chart?
Not all zones are equal; they should be graded accordingly. A three-tier system based on origin and freshness is useful: high-grade zones are untouched and formed on higher timeframes; mid-grade zones have one clean retest; and low-grade zones are repeatedly wicked through. This aligns with the “three key levels” concept from PriceActionNinja (2025), providing clear language to prioritize trade capital. When zones stack across timeframes, precedence should be given to the higher-timeframe footprint. Lower-timeframe touches can serve as precision entry points rather than independent signals.
How should I protect my position from stop-hunts and false breaks?
Traders should expect short spikes around clear zones, especially at market open and during major reports. It's a good idea to use staggered entries: take a partial limit at the edge of the zone, keep some reserve to add once a clear directional candle shows up, and set stops beyond a volatility buffer instead of just a single wick low. Even though going full-size on the first touch might have been common in trading, it can lead to emotional stress and mistakes as noise builds up. Platforms like AquaFutures offer instant simulated funding and evaluation conditions with large capital and realistic rules. This helps traders practice staggered sizing and strict stop rules under pressure without risking personal capital, effectively addressing the steep learning curve that can hold back growth.
What should I log to ensure my zones improve over time?
Every time a zone is mapped, record five key fields: the timeframe and timestamp, the ATR at that moment, the retest count along with dates, entry and exit details including size scaling, and a one-line behavioral note explaining your entry rationale. By running monthly queries on expectancy by zone grade and timeframe, you can turn intuition into actionable data. This process will indicate whether a zone type is sufficiently consistent for scaling.
What is the practical approach to using zones?
To keep this practical, think of each zone as a borrowed tool. Test how well it works, return any parts that wear out, and invest only in those that remain useful after repeated use.
What is the hardest piece to master in trading zones?
While that solution sounds neat, the frustrating part is that this is not the hardest thing to learn in trading zones.
How To Draw Supply Zones
Treat zones like living data, not static art. Draw the rectangle, then assign measurable attributes to it so you can track whether it will behave like a tradable supply pocket or a faded relic. Key attributes include: a timestamp, the time of day of formation, session context, retest count, average fill width, and a decay score that you update after each touch.
How do I quantify a zone's strength?
To determine a zone's strength, start with a simple scorecard that translates observations into rules. Give each zone points for: formation on a higher timeframe, a decisive price impulse away from the base, no intervening structure, and alignment with volume or footprint evidence. Add negative points for each retest and deduct extra points when the zone forms during periods of thin liquidity, such as late sessions or holiday sessions. Over time, you will find which point combinations often lead to positive outcomes, helping you to remove zones that never score high enough to risk capital.
When should I widen or tighten the drawn rectangle?
Let execution limits decide the width. Widen the rectangle if the instrument’s spread, volatility, or funding tick size would cause an unnecessary stop. On the other hand, tighten the rectangle if several clustered wicks show a tight institutional fill. A helpful rule is to set the initial boundary to include the high and low of the base candle cluster. Then, only expand it by one spread plus a volatility buffer if the average execution slippage exceeds your risk tolerance. This method keeps the zone accurate and in line with the real cost of entering a trade.
How do I use market structure cues beyond candles?
Think about the importance of session overlap and auction context. A supply base that is created during a London-New York overlap, especially after a significant drop, has different meanings than one made in a quiet Asian session. It's helpful to add in volume profile, order flow spikes, or clear liquidity clusters to confirm that the base held unfilled resting sell orders. When several pieces of evidence come together, view entries as precision-limit opportunities rather than relying on guess-driven stops.
What execution tactics reduce slippage and false triggers?
Prioritize passive limit laddering and staggered sizing over using a single full-size limit. Start by placing the first limit at the nearest edge. Save a second limit for the middle area, and protect it with a stop just beyond the far boundary, plus a measured volatility buffer. If part of your order gets filled and the price shows quick rejection candles, add the rest of your size. If the price easily goes through the zone, cancel the ladder and move on. Keeping your order types simple helps you react quickly when the price behavior changes.
Why track a zone's lifecycle quantitatively?
Visual confidence can be misleading. A zone that looks perfect at first may lose its effectiveness after just two quiet tests. On the other hand, a worn-looking zone might become important again if it gets a strong rejection on high volume. It's crucial to set a decay half-life based on sessions or retests and to retire zones that fall below your minimum expected level. This method changes map maintenance from guesswork into disciplined capital allocation.
How can traders improve their mapping technique?
Most traders map by eye because it is easy, but the hidden cost is inconsistent sizing and overcommitment as accounts grow. The common method is hand-drawn zones without a scoring system, which works until you try to put down real money, and the same rules don’t work with real slippage, execution noise, or evaluation limits. Teams find that simulated-funded environments with clear evaluation rules enable traders to address the scaling problem directly. Platforms like AquaFutures offer large simulated capital limits, clear performance targets, and quick payout systems, so traders can practice order sizing, zone decay scoring, and execution under real conditions without risking their own money.
What backtest steps demonstrate that a zone-style works?
Define the entry logic, sizing ladder, and stop rules. Then test on walk-forward chunks rather than a single long in-sample period. Record expectancy for each zone grade, each session, and each retest count. Track execution friction metrics, which include average slippage, fill rate on the first limit, and time-to-fill. Use these numbers to change a promising setup into a rule that tells you how much of a funded allocation to risk on first contact versus confirmation.
What common errors impact trader performance?
This pattern appears among both retail and prop traders. The failure point is often subjective mapping and inconsistent follow-through. When traders use scored, time-stamped zone maps and execution rules, their performance curve smooths out. This makes their decisions repeatable rather than driven by impressions.
How should I perceive each supply zone?
A final practical image: think of each supply zone as a rentable storefront instead of owned real estate. This means you can try it out, test sales, and end the lease when revenue goes down. This approach is more flexible than stubbornly keeping it just because the signage looked good.
What common mistakes lead to underperformance?
According to a Reddit user, 80% of traders fail to properly identify supply zones due to incorrect chart analysis. This mistake occurs frequently and explains why many zone maps do not perform well. Combining zone signals with other technical tools usually makes things clearer. In fact, traders have seen a 30% increase in accuracy when using supply zones with other technical indicators. This evidence underscores the importance of not mapping in isolation, but of using supporting indicators to improve trading success.
Related Reading
- Basic Trading Strategy
- Spot Algorithmic Trading
- Forex Trading Profit Per Day
- Crypto Trading Bot Strategies
- Best Forex Trading Bots
- Fair Value Gap Trading Strategy
- Best Leading Indicators for Day Trading
- Best Indicators for Swing Trading
- Best Charting Software for Day Trading
- Best Indicators for Options Trading
- Fair Value Gap Trading Strategy
How to Trade Using the Supply and Demand Trading Strategy

Treat supply-and-demand setups like a business process: choose the exact zone types you trade, turn your entries and exits into clear rules, and run those rules with realistic execution and scaling plans. This helps your edge turn into predictable payouts. By doing this, you stop guessing and start managing probability, position size, and trade cadence like a professional.
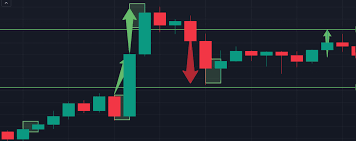
1. Identify High-Quality Supply and Demand Zones
Begin by reviewing charts of consolidation periods, followed by significant price moves. Demand zones form during short sideways moves before sharp upward rallies, indicating that buyers are aggressively placing sell orders. Supply zones appear during brief pauses before sharp declines, indicating that sellers are in control. Concentrate on bases with narrow ranges and few wicks, as these hint at efficient imbalance. Use higher timeframes, such as daily or 4-hour charts, to identify major zones, then switch to lower timeframes for greater accuracy. Stronger zones show aggressive moves with high-momentum candles.
2. Draw Zones Accurately on Your Chart
Mark zones using the proximal (closer to the current price) and distal (farther) lines around the consolidation body. For demand, the zone extends from the lowest point to the point at which the price begins to rise. For supply, it goes from the highest point of the pause to where the drop begins. Avoid making rectangles too wide, as they can distract; keep them tight around the candles that come before the move. Fresh zones, those that haven’t been tested since they formed, hold the most power because orders are still waiting. Consistency across assets supports reliable pattern recognition.
3. Determine Market Context and Bias
Look at the overall trend on longer timeframes before finding trading areas. In uptrends, focus on demand zones to buy during pullbacks to maintain the bullish trend. On the other hand, in downtrends, look for supply zones to sell during retracements. In sideways-moving markets, trade by bouncing between opposite zones. Look for confluence, like moving averages, volume spikes, or important levels, to increase your confidence. If you’re exploring ways to enhance your trading, consider looking into funded accounts for futures trading. Stay away from counter-trend trades unless you have strong proof of a reversal.
4. Plan Entry Points with Confirmation.
Wait for the price to retest the zone before buying, rather than buying immediately after the first move. Use limit orders near the nearest line for easy entries, or enter based on price action signals, such as rejection candles or engulfing patterns, in the zone. You should look for buying opportunities near the lower edge when there is bullish confirmation, and for selling opportunities near the upper edge when there are bearish signals. Being patient helps you avoid entering trades too early and ignoring weak reactions.
5. Set Stop Loss and Manage Risk Effectively
Place stops just past the edge of the zone to allow for small overshoots without being stopped out too early. When buying on demand, place stops below the zone's low; when selling on supply, place them above the high. Never risk more than 1-2% of your account's capital on each trade by changing the position size according to the stop distance. This method helps guard against false breaks while keeping your capital safe and open to more trading opportunities.
6. Define Exit and Take Profit Targets
To figure out take-profit targets, look at the next opposite zone. The price usually reacts there due to opposing orders. Consider scaling out partially at mid levels or using trailing stops behind swing points to capture extended moves. In trends, aim for higher risk-reward ratios, such as 1:3, by holding toward momentum targets. Exit completely if you see signs of weakening, which could indicate a loss of momentum or nearing an opposing zone.
7. Incorporate Additional Filters for Higher Probability
Improve your trading setups by using tools such as the spring pattern (a false breakdown before a rally) or a strong breakout from the zone. Focus on untested zones and avoid revisited ones, as they lose strength over time. Use multi-timeframe analysis and avoid news-driven volatility unless it aligns with your strategy. Backtest your setups to improve your personal rules and keep a trading journal for continuous improvement.
How should you manage streaks and behavioral risk during evaluations?
These guidelines are based on core price action principles and institutional dynamics observed across various markets. To manage streaks and behavioral risk during evaluations, set clear stop-trading triggers based on measurable conditions instead of emotions. For example, stop trading for the day after three losing trades in a row that are greater than your average loss. Or consider pausing after a trade with slippage more than twice your historical average. Keep a brief behavioral note for each pause that explains the reason and the action you took. Then review the last 10 fills to ensure the market did not change significantly. This discipline helps protect both capital and confidence. Such patterns may seem in order until one execution habit quietly harms your cash flow: a reality many overlook.
Tips and Tricks For Supply and Demand Trading Strategy
The practical edge in these tips comes from reading where liquidity actually is. It is important to create rules that can handle quick, messy fills. Traders should pay attention to session-based liquidity, order flow signatures, microstructure-aware stops, and a funding-friendly instrument plan. This method ensures that entries can scale effectively without being overloaded under real execution pressure.
1. Look for Moderate Volatility in the Zone.
High-quality demand zones often exhibit tight, narrow price movements just before a significant upward move. If there are wide swings, long candle wicks, or lots of back-and-forth movements in the zone, it means there's uncertainty, making future reactions less reliable. Narrow consolidation indicates a clear imbalance, with buyers overpowering sellers and typically offering little resistance. This situation significantly increases the likelihood of a strong bounce when the price returns to test it, as there are unfulfilled buy orders waiting. Traders should focus on zones with calm periods of consolidation, as these are better than those with high volatility for identifying potential opportunities. This aligns with how our funded futures accounts streamline your trading experience.
2. Prioritize Short Consolidation Periods
Effective supply zones typically form after short periods of price movement, when the market briefly stabilizes during a downtrend. If the market stays flat for too long, it weakens the imbalance, making the zone less powerful for selling later. Quick consolidations indicate sellers are strong, with the price moving only a few times before it starts to decline again. When the price comes back up to test it, this often triggers more selling, as orders on hold begin to be triggered. In strong downtrends, these quick "drop base drop" patterns indicate strong downward momentum.
3. Watch for the Spring Pattern
The spring is a concept in Wyckoff theory that features a short false breakdown below a potential demand area. This method catches sellers off guard before a rapid price increase. It appears to be a bearish fakeout, tricking retail traders into short positions while allowing institutions to buy at favorable prices. This pattern indicates strong underlying demand, as the dip quickly fails and triggers a large rally. Traders can use it to check zone strength, and entering long positions after the reversal indicates that supply has been exhausted. It shows how smart money traps less experienced traders for better deals.
4. Seek Strong Momentum, leaving the zone.
The most reliable zones appear before major breakouts, with significant strength. Sharp, clear price movements away from a zone indicate heavy order absorption and an imbalance, creating significant unfilled interest for future reactions. Strong moves away from the zone, especially after a short period of stability, suggest institutional involvement and a higher chance of a retest. Focus on the strongest momentum shifts on charts, as these create premium zones with lasting impact.
5. Trade Only Fresh Zones
Fresh zones, or areas that haven't been tested since they were created, have the highest potential because initial orders are mostly unfilled. Each time these zones are revisited, more orders are filled, gradually weakening the level through absorption. Untested zones keep their maximum strength for price reversals or continuations. It is important to avoid revisiting areas too often, as repeated tests reduce their reliability. This process is similar to how traditional levels lose strength over time. By focusing on freshness, traders can improve their chances in setups.
6. Avoid Amateur Traps and Wait for Confirmation
Many new traders jump into trades too early at clear levels. They often buy right at support or sell at resistance without waiting for signals from price behavior. Markets often go past these points, hitting stops before reversing. Being patient and waiting for clear signals of a reversal, such as rejection candles or patterns in the zone, can help. This method leverages common mistakes made by retail traders when trading with institutional movements. By combining these signals with other confirmations, you can find better chances for successful trades.
7. Leverage Prop Firm Funding
Mastering supply and demand zones becomes even more powerful when you trade with bigger money that isn't yours. Prop firms offer funded accounts, which allow skilled traders to increase their positions and boost returns from high-probability setups without risking their own capital in the event of losses. AquaFutures is a top firm in the futures space. They offer instant funding options or paths to evaluation of up to $450K, generous profit splits (often 100% on initial profits), quick payouts, and trader-friendly rules designed for futures markets, where supply-and-demand strategies work well. This setup allows you to apply these zone strategies with significant leverage while remaining disciplined.
How can AquaFutures help you in trading?
Ready to take your supply-and-demand trading to the next level with funded capital? Join thousands of traders who trust AquaFutures for transparent rules, fast support, and real capital. Explore our account options and get funded today to advance your trading journey. Unlock up to 50% off your first funded account, plus surprise BOGO deals and bonuses that are updated weekly.
Unlock up to 50% off Your First Funded Account for Futures Trading
When you can identify supply and demand zones but still struggle to turn them into reliable profits, the problem often lies in your execution, not your charts. Consider using AquaFutures-funded accounts for futures trading as a viable solution. This approach allows us to test a supply-and-demand trading strategy using real fills and sufficient liquidity, helping you expand the entry and risk rules that can lead to real payouts. funded accounts for futures trading
Related Reading
- Fibonacci Trading Strategy
- Best Prop Trading Firms
- ORB Trading Strategy
- Crypto Swing Trading Strategy
- Best Copy Trading Platform
- Best Proprietary Trading Firms for Beginners
- Best Stocks for Options Trading
- Silver Bullet Trading Strategy
- The Strat Trading Strategy
- Supply and Demand Trading Strategy
- Profitable Gold Trading Strategy
- Higher High Lower Low Trading Strategy
