


A Complete Guide to Trading Patterns
The Trading Patterns guide offers clear entry rules, backtested setups, and risk controls to boost trading performance. Learn practical strategies with AquaFutures.

Technical charts can appear overwhelming due to the mix of candlestick patterns, trendlines, and indicators. A careful approach distinguishes noise from clarity by revealing key price configurations such as support, resistance, breakouts, and candlestick formations. Trading patterns help interpret momentum and detect reversals, transforming complex data into actionable strategies.
Methodical risk management paired with clear chart insights reduces guesswork and promotes steady account growth. Precise entries and controlled losses become achievable through disciplined pattern recognition and measured trade management. AquaFutures offers funded accounts for futures trading, providing real capital trading opportunities while focusing on systematic risk control.
Summary
- Chart patterns are a mainstream tool: over 70% of traders rely on them, and studies report up to 80% predictive accuracy, making pattern literacy a foundational skill rather than a fringe tactic.
- Narrowing focus improves execution, so pick a small set, such as two reversals and two continuation patterns, and backtest them over fixed timeframes, with a suggested 30 trading day drill to validate real-world reliability.
- Volume and confirmed closes matter because, statistically, tradable patterns like Head and Shoulders show an 83% success rate only when price and volume validation accompany the breakout.
- Operational metrics include pattern edge, R-multiple, average holding time, slippage, and drawdown contribution. Note that pattern-based strategies can reduce trading risk by up to 25% when applied with proper weighting and filtering.
- Rehearsal beats intuition; run a focused 30-day drill, log 50 candidate setups, and measure checklist pass rate, realized slippage, and time-to-execution. Traders using chart patterns have reported a 15% increase in success when disciplined execution is applied.
- Correlation and signal cadence change sizing decisions because a pattern with a high win rate (for example, Double Top at 78% or Cup and Handle at 65%) is useless if it only appears once every six months—weight exposure by frequency and correlation buckets.
- This is where Aquafutures's funded accounts for futures trading fit in, aligning transparent evaluation stages, rule-based funding, and predictable payout mechanics with pattern-focused execution and scaling.
What are Trading Patterns?
Trading patterns are price behaviors that repeat and offer a potential advantage, but they are not guaranteed. They show how market psychology creates shapes that can be traded using specific rules.
This method promotes trading based on a disciplined plan rather than hasty decisions. If you're considering starting, look into funded accounts for futures trading, which can help support your trading journey.
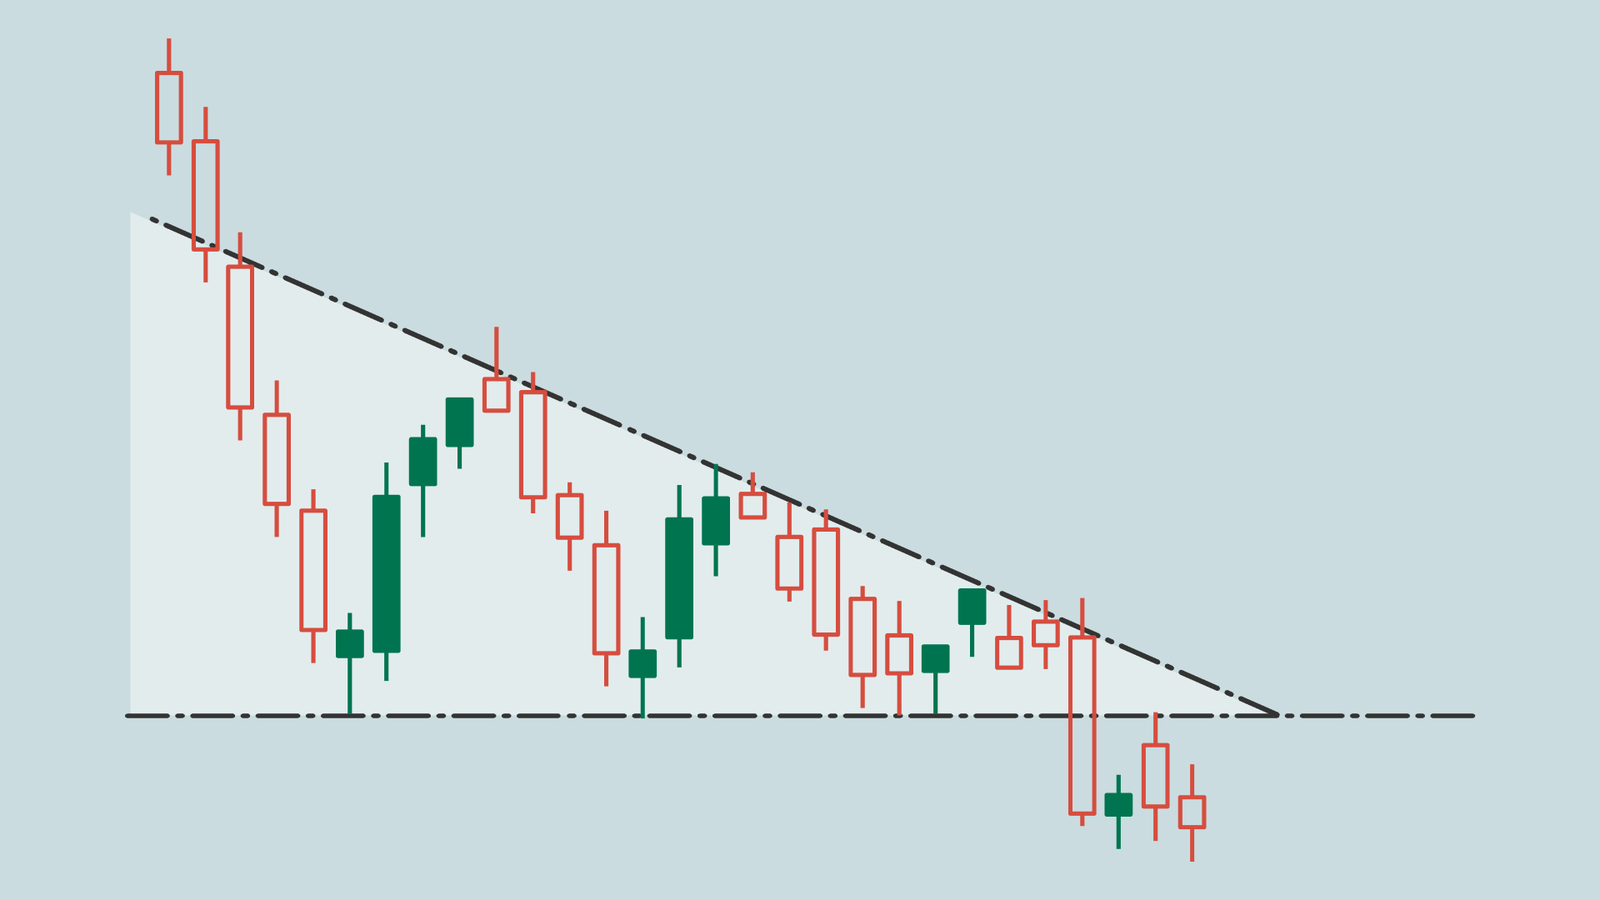
What do patterns really show about supply and demand? Patterns reveal how buyers and sellers work through their disagreements over time. For example, a triangle forms when one side slowly gives way while the other side pushes ahead.
As a result, the breakout direction usually indicates which group has lost patience. Reading volume is critical to understanding the market's mood, as patterns without volume context can be misread.
Which patterns deserve priority in a disciplined evaluation?
Start with patterns that fit neatly into rules you can verify and reuse. Choose two types of reversals and two types of continuations, then test them using a backtest over set time periods, entry rules, and where to place stops.
After reviewing many evaluation accounts, a common finding emerges: traders who keep their checklist small and focus on a few well-tested strategies reduce confusion and improve execution consistency during timed challenges.
How should you confirm a pattern to avoid false breaks?
To confirm a pattern and avoid false breaks, wait for a close beyond the pattern line while looking for a volume confirmation band that supports the move. Relying only on visual patterns can lead to misleading signals.
When traders overlook this critical step, they cede control to market noise, allowing stop hunts to erode their advantage.
This failure mode is standard: pattern recognition can work well until traders ignore volume, leading to inevitable failures.
How do you combine patterns with indicators without diluting clarity?
Use indicators as filters, not crutches. For example, pair a breakout from a rectangle with a moving average trend filter and a volatility-based stop. This approach preserves pattern repeatability while improving the signal-to-noise ratio. When too many indicators are used simultaneously, decision-making slows, increasing errors during evaluation windows.
Which human errors undermine otherwise sound pattern setups?
A common problem in trading is emotional impatience. Traders often jump in before they have confirmation to avoid missing a chance, but they then begin to doubt their decisions when prices decline. This pressure intensifies during uncompromising evaluations, when targets and losses feel personal. It is a pattern seen among traders pursuing timed qualifiers: they may tighten their stops or increase their position size to make up for losses, which works against them mathematically.
How reliable are patterns in practice?
Pattern literacy is a mainstream skill that traders should master to improve their performance in evaluations. Some studies show that chart patterns can predict market movements with up to 80% accuracy.
Therefore, it is essential to focus on repeatable execution, risk controls, and verification steps to keep that statistical advantage.
What practical habit will change your performance tomorrow?
Turn each pattern into a one-page rule that clearly shows when to enter, when to stop, your target, and how to confirm volume. Only trade by that rule during a specific time, and keep a record of every trade for later review. After 30 trading days, this discipline will show which setups are strong in your timeframes and which are just false signals. Think of the rule as a compass that helps you stay on track when price changes might lead you off course.
How does mastery of patterns change your trading approach?
Mastery happens when recognizing patterns shifts from guessing to a simple set of habits you can use even under pressure. But to implement this change, you will need to rethink how those habits fit within a complete trading system.
Related Reading
- What Is a Funded Trading Account
- What Is SMT in Trading
- Price Action Trading
- Intraday Trading Tips for Today
- Can Day Trading Be Profitable
- Trading Indicators
- Forex Trading Candlestick Patterns
- Intraday Algorithmic Trading
- Trading Candlestick Patterns
- Volatility Trading
How Can Trading Patterns Be Used in a Trading Strategy?
Trading patterns can be transformed into a strategic system by treating each setup as a measurable signal. Each pattern should include a set edge, a sizing rule, and a monitoring plan used consistently across instruments.
Once conviction, execution, and failure modes for each pattern are clearly defined, the trader can shift from guessing to properly managing probability and risk. This is similar to a trader who plans to gradually increase their investment in funded accounts for futures trading.
How should I weight patterns across my book?
Focus on expected value and correlation rather than appearances. For every pattern you trade, it's essential to keep track of its win rate, average win-to-loss ratio, and how often it shows up with different instruments. Convert these numbers into relative weights for your capital allocation.
If you have several high-frequency patterns that are very similar, downweighting them can help prevent one bad move from putting your whole strategy at risk. According to LinkedIn Pulse, "Pattern-based strategies can reduce trading risks by up to 25%." In 2025, this reduction occurs when you apply careful weighting and filtering while consistently following pattern rules across your portfolio.
Which operational metrics matter most?
It is crucial to track the R-multiple per trade, average holding time by pattern, slippage against ideal fills, and drawdown contribution per setup. These four metrics help you understand if a pattern is a real advantage or just random noise.
Additionally, think about how many valid signals you get each month. Balancing edge against opportunity cost is important; an identical expectancy is not helpful if it occurs only once every six months, especially when you need steady cash flow to pass an evaluation window. Considering funded accounts for futures trading can provide additional options.
How should you size and scale by conviction?
Use a tiered sizing ladder based on documented conviction. If a pattern passes your out-of-sample reliability checks and execution rehearsals, move from the baseline size to a higher tier in controlled increments as the trade proves itself—scale only on favorable price action that you have already realized. The size should be adjusted for volatility and driven by the pattern's specific expectancy, not by your emotions. This way, you can avoid the common mistake of increasing size to try to recover losses, which compounds risk instead of fixing it.
What happens when ad hoc setups are used?
Most traders use ad hoc spreadsheets and manual filters for their setups because they like the flexibility and low cost. This is understandable. However, as the number of signals increases and the stakes go from demo to evaluation, this familiarity can become a problem. Rules may be applied inconsistently, record-keeping can be messy, and evaluation timers may penalize sloppy execution.
Platforms like AquaFutures offer transparent evaluation stages, automated rule checks, and predictable payout systems. This helps traders focus on improving their pattern rules and execution instead of dealing with administrative hassles.
How do you prove robustness before you trade real capital?
To show that your strategy is strong before you trade with real money, do walk-forward tests and out-of-sample checks in different market conditions. It is important to include costs such as execution fees and slippage, and to use Monte Carlo simulations to model potential losing streaks.
This helps you consider worst-case scenarios. Also, comparing how the pattern behaves across similar instruments helps ensure the results you see are not due to the specifics of a single ticker.
What breaks sound pattern systems under pressure?
This failure is apparent among retail traders and in timed evaluation situations. As the checklist lengthens, executing well under time pressure becomes more difficult. This leads to false signals and premature entries. The solution focuses on limits instead of just motivation.
Reduce actions to a few reliable patterns, document the exact steps for entering and failing, and practice execution until it becomes muscle memory while the timer is ticking.
What practical steps can you take to get started?
- Pick two patterns to trade for 30 trading days.
- Define clear, measurable entry triggers and two explicit failure modes.
- Log every trade with R-multiple, slippage, and post-trade notes.
How should you view trading patterns?
Patterns are tools, not promises. Think of them like signed contracts with probability clauses. They may sometimes deliver successful outcomes, but they can also fail. Your job is to size, test, and enforce the contract.
Why does understanding pattern types matter?
That simple change in how you look at patterns is essential, but it's not enough. Knowing the different types of patterns is more important than you might think, and what comes next will show why it matters.
What are the Different Types Of Trading Patterns?

Different pattern families need special entry movements, timeframes, and failure rules. Each should be viewed as an operating checklist rather than a static picture.
Reversals need confirmation and retests to be reliable, while continuations reward momentum and careful entries. Also, candlestick signals work best when context, volume, and volatility align.
What is the Head and Shoulders pattern?
This setup shows a reversal that ends an uptrend. It has three peaks: one higher middle peak with two lower shoulder peaks on each side. A neckline connects the lows between these peaks. If the price breaks below this neckline, it confirms a bearish reversal and signals that sellers are in control.
Volume usually peaks at the left shoulder and decreases toward the right, which makes this pattern more reliable.
What does a Double Top indicate?
This pattern forms after prices go up. It is a bearish reversal pattern that shows two peaks at nearly the same height, with a dip in between, like an "M". When the price hits the resistance level twice and fails to move higher, it indicates that buyers are becoming weaker.
If the price drops below the dip, it confirms the pattern, making it a good time for short entries. This indicates bullish momentum is waning.
How does a Double Bottom signal recovery?
A bullish reversal that shows up in downtrends; this "W"-shaped pattern has two lows at the same support levels, with a peak in between.
When support holds twice, it indicates buyers are gaining strength.
A breakout above the peak indicates potential for prices to rise. Traders often aim for the pattern's height to be projected upwards.
What signifies a Triple Top pattern?
The triple top is a well-recognized chart pattern in technical analysis.
This extended bearish reversal looks like a double top but has three peaks testing the same resistance, creating several "M" waves.
Ongoing failures to break higher eventually tire out the bulls. When a neckline breach happens, it sparks significant downward moves. Also, lowering the volume of the latter peaks makes the signal stronger.
What should you know about the Triple Bottom?
Triple Bottom is a big pattern in technical analysis. It appears opposite the triple top and suggests a potential price rise.
This pattern happens during downtrends and has three equal lows that buyers help maintain, forming 'W' shapes. When the price rises above the high of the middle peak, it confirms a reversal and indicates potential gains equal to the pattern's depth. It clearly shows where strong support zones exist.
How are Flags used in trading?
Flags are a type of continuation pattern often seen in trading.
During uptrends, flags appear as short rectangular consolidations against the trend. These shapes form a lower volume. A pole forms from the previous sharp move, and a breakout in the trend direction usually resumes momentum. Flags indicate short pauses before more acceleration.
What are Pennants in trading?
Pennants are a lot like flags. They are patterns that form into small, symmetrical triangles after strong price moves, called poles. The price moves together on lower volume before a breakout happens, matching the length of the pole. They show a short balance point before the trend continues.
What is an Ascending Triangle pattern?
An ascending triangle is a pattern that can show a bullish continuation or reversal. It has a flat upper resistance level and rising lows. This formation indicates that buyers are slowly pushing the support level up.
When there is a breakout above the resistance level with increasing volume, it usually provides targets based on the triangle's base. This pattern shows increasing demand pressure.
What does a Symmetrical Triangle indicate?
This is a neutral continuation pattern that narrows as trendlines converge, creating coiling volatility. The price direction follows the previous trend when a breakout occurs, and volume confirms the move. It indicates market uncertainty that will be resolved soon.
How is the Cup and Handle pattern formed?
This is a bullish continuation pattern that resembles a rounded "U" bottom with a small downward handle at the end. The handle slopes gently against the uptrend, and a break above its resistance suggests additional buying. The cup's depth typically matches the target distance.
What does a Hammer Candlestick indicate?
This single-candle reversal at downtrend bottoms has a petite body on top of a long lower wick that is twice the body's length. It shows that sellers are unable to keep prices low as buyers enter, particularly when volume is high near support. Confirmation happens when the next candle closes higher.
What significance does a Doji hold?
A Doji is a neutral candlestick pattern in which the opening and closing prices are nearly equal. It looks like a cross or a plus sign after trends. This candlestick shows the balance between buyers and sellers and suggests possible reversals. Its significance increases at essential levels.
Context from previous candles helps us determine whether there is a bullish or bearish bias, especially when considering funded accounts for futures trading.
When should you prioritize one pattern over another?
When deciding whether to focus on one pattern over another, it's essential to match the pattern type to your instrument and trading session.
Patterns that appear quickly on high-volume futures contracts act very differently from the same pattern on a thinly traded forex pair. Therefore, traders should evaluate each setup by considering frequency, average R-multiple, and slippage before risking real money.
How can you trust a Head and Shoulders pattern?
Head-and-shoulders formations often create precise risk geometry, but this clarity only appears when there is volume and a clear neckline close that confirms the pattern. In practice, it's better to enter on a clean break, sizing your position based on the measured distance from the head to the neckline. Also, consider adding to your position only if a retest fails, provided volume decreases during the return, and your stop is placed above the last shoulder.
What distinguishes Double Tops and Bottoms?
Double Tops and Bottoms require different actions because they show different market patterns. Traders often misinterpret these patterns, treating two equal highs or lows as proof rather than a warning. Vital warning signs include momentum divergence, fading volume on the second test, and tighter ranges in between the peaks and troughs.
Use the point between the two levels as your entry signal. It is a good idea to place stops a few ticks past the closest reversal point. Consider taking some profit at the pattern depth while keeping some of your position for momentum continuation if volume increases after the breakout.
What do you need to know about flags, pennants, and triangle trades?
Flags and pennants are short-term continuation plays that reward momentum entries right at the breakout. Targets are measured by the pole length, with tight ATR-based stops placed under the consolidation.
Triangles require patience; they coil volatility, leading to possible false moves until a breakout occurs with sufficient volume. It’s helpful to prefer trades that offer a retest zone for adding positions if confirmation is needed. Think of flags as a spring and triangles as a compressed spring; trading strategies should reflect these dynamics.
When should candlestick signals be considered?
Single-candle reversals, such as hammers, and neutral shapes, such as dojis, depend on the context. Treat a hammer as a message from buyers instead of a directive; the next candle needs to confirm the trend, and volume can help assess confidence.
Dojis indicate indecision, which becomes more significant only at clear support or resistance levels, especially when reinforced by other indicators such as VWAP or pivots. Relying only on trendlines can be too subjective when you're under time pressure.
How should your approach change with pattern type?
Use volatility-adjusted stops instead of fixed pip counts. For reversals, keep your size small and place stops beyond the last swing, adding a volatility buffer.
In contrast, for continuations, use tighter stops and increase your position as momentum confirms. It's also essential to track how often the pattern appears: a profitable pattern that occurs once every six months won't be helpful during a time-based evaluation. Therefore, consider patterns based on both expectancy and practical signal cadence.
How does human failure affect trading?
While trading may seem technical, human failure modes are a big part of the process. This challenge impacts traders of all levels. Many teaching resources make patterns more complex, and trend lines can feel unclear. As a result, traders often guess when under pressure and may abandon the rules as time runs out.
When this happens during the evaluation stages, inconsistency increases, and small mistakes can lead to missed targets.
How can you improve rule-based trading?
Most teams manage pattern selection by adding more rules. This method may seem thorough, but it doesn't always support execution. As the number of trades increases, this familiar method is less effective because additional rules slow decision-making and create challenges during live runs.
Platforms like Funded Accounts for futures trading centralize rules, provide clear evaluation metrics, and automate payout mechanics. This allows traders to stay consistent while concentrating on execution and scaling.
How do you develop durable trading habits?
How do you turn pattern insight into strong habits? Measure each pattern over three time frames: the best entry, average slippage, and the realized R-multiple over a 90-day walk-forward sample. If a setup loses more to slippage than it gains in expected value, eliminate it.
Keep a short rule card for each pattern that explains the exact trigger, stop, target, and failure mode. Practice executing it until muscle memory replaces hesitation, because timing issues cause more problems than chart-reading mistakes.
What analogy helps understand trading patterns?
A straightforward analogy is that trading patterns resemble theater stage directions, not acting scripts. They show where the drama will likely change, but traders still need to hit their marks under bright lights, with noise, and in front of a crowd that never sits still.
What is AquaFutures' offer to traders?
AquaFutures gives traders quick, affordable access to funded accounts for futures trading. The options include instant features, clear rules, and honest payouts. Whether traders want to avoid evaluations or develop through performance-based scaling, our programs are meant to reward consistency without extra restrictions.
What is the next step in mastering trading patterns?
The following section highlights the single habit that distinguishes recognizing patterns from consistently making money from them. This habit is more complicated than most people think.
Related Reading
- Basic Trading Strategy
- Spot Algorithmic Trading
- Forex Trading Profit Per Day
- Crypto Trading Bot Strategies
- Best Forex Trading Bots
- Fair Value Gap Trading Strategy
- Best Leading Indicators for Day Trading
- Best Indicators for Swing Trading
- Best Charting Software for Day Trading
- Best Indicators for Options Trading
What is the Best Way To Identify Trading Patterns?
Start by building a tight, reproducible process. Use scanners to identify candidates, then apply a quick human checklist that aligns a higher-timeframe bias with a lower-timeframe trigger and a clear execution plan.
By practicing confirmation and placing orders carefully, traders can shift pattern recognition from guesswork to a tradeable skill that can be applied effectively in timed evaluations.
Select Reliable Chart Types
Candlestick charts are the best option for finding patterns because they show the open, high, low, and close prices for each time period. These visuals help us understand market sentiment by examining the body size and wick length, making it easier to determine whether there is more buying (bullish) or selling (bearish) pressure.
When you use volume bars with candlesticks, they give extra support to the signals, since higher volume usually makes the pattern signals stronger.
Establish Key Trends First
Start by drawing trendlines to connect higher lows in uptrends or lower highs in downtrends. This helps set the stage for patterns to show up. Reversal setups, such as head-and-shoulders patterns, occur at the ends of trends. Meanwhile, flags or wedges indicate that a trend will continue.
This critical step helps eliminate distractions and aligns patterns with the larger momentum.
What patterns should I focus on for trading?
Focus on core formations when looking for trading opportunities.
High-probability shapes, such as triangles that narrow as trendlines converge, indicate building tension before breakouts.
Double tops or bottoms appear at resistance or support levels and are confirmed by failed retests.
The head-and-shoulders pattern features a central peak with shoulders on each side, with an approximately 65% reversal success rate across assets, according to academic studies, including the National Science Board's report. Utilizing our funded accounts for futures trading can enhance your trading strategy by providing crucial resources.
How can I confirm my patterns before executing trades?
Look for volume spikes during breakouts to confirm patterns, because low volume can indicate weakness. Use tools such as moving averages or RSI to determine whether prices are too high in topping patterns or too low during bounces from bottoms.
Getting multiple confirmations can lower false signals and improve trade accuracy.
Should I practice identifying patterns using historical data?
You can backtest patterns by using past charts to see how often you win under different conditions. This helps you get better at recognizing patterns over time. Keep a journal to record your entry points, outcomes, and market context.
This will help you improve continuously. If you review your notes regularly, spotting patterns will become easier and help you make consistent profits.
How should I manage different timeframes for trades?
Which timeframe should be trusted for bias versus trigger? A split-stack approach works well: use a higher timeframe for directional bias, an intermediate timeframe for structure, and a lower timeframe for the actual trigger.
For many futures traders, this typically means using the daily chart for bias, the 1-hour chart for structure, and 5- or 15-minute charts for execution. This stacked approach balances clarity with signal cadence during evaluation windows.
If your instrument is speedy and liquid, consider shortening the trigger timeframe; conversely, if it is thin, widen the timeframe to prevent noise from masquerading as a setup.
How do I prioritize signals for trading success?
To grade and prioritize signals for optimal trading, create a compact scoring card with five key inputs: multi-timeframe alignment, valid structural trigger, volume context, spread and liquidity, and confirmed execution opportunity. Assign each input a pass/fail threshold, and convert the total into three action bands: watch, prepare, or trade.
Pattern reliability is not theoretical; it varies by shape, time, and market structure.
Therefore, your score should boost double-top candidates into higher-priority bands only when the other inputs align.
When should I rely on scanners for trades?
When should you trust scanners instead of your own analysis? This question comes up in both short-term and swing trading. Scanners are effective at presenting large amounts of data, but they often miss important details. They can spot many valid patterns but may not catch small retests or issues in the order book.
Treat scans as a starting point, not the final decision. Set aside short time blocks to review scanner results, narrow them down to a shortlist, then use your scoring card. This way, you can maintain automation speed while still using your own judgment, especially when timing and risk are critical.
What challenges do traders face without a structured process?
Most traders set up their strategies using scans, screenshots, and spreadsheets because this way feels familiar and doesn't require any new process. While this works well at first, as signal counts increase and evaluation timers get shorter, records become scattered. This can slow down decision-making and make progress difficult.
Solutions like AquaFutures' funded prop-trading programs bring together rule checklists, provide clear evaluation stages and payout methods, and enable faster feedback. These improvements help traders refine their pattern rules and execute faster while maintaining consistent records.
How can I automate pattern recognition?
To automate pattern recognition, practice through a focused 30-day drill. Choose two patterns, log 50 candidate setups, and execute trades in a demo environment that matches your expected fills and latency. For each candidate, track three key metrics: your checklist pass rate, realized slippage, and time-to-execution.
Treat this practice like stage work: set a timer, prepare your entry orders, execute trades, and log results without editing.
This method helps develop muscle memory, reducing hesitation during real evaluation runs.
What execution strategies maintain a trading edge?
Pre-place limit orders at trigger zones when liquidity and spread allow, because market orders can eat into profits during thin moments. Use graded scaling to confirm momentum rather than averaging “add to loss” strategies.
Protect the position with volatility-adjusted stops linked to the pattern’s geometry. Also, plan partial exits at measured objectives to lock in wins while letting a proven breakout continue.
How can I prevent false signals in trading?
Start with three quick, fail-fast checks: a liquidity check to verify accessible volume at the planned price; a spread check to rule out wide fills; and a divergence check against a momentum indicator tuned to your timeframe.
If any check fails, downgrade the signal; if all checks pass, proceed with your pre-scripted order choreography.
How does emotion affect trading performance?
Pattern work is technical, but emotion is the real opponent. It can be exhausting when a scanner lights up, and your gut says no.
That split second of doubt often turns good rules into sloppy execution under evaluation pressure.
Think of practiced pattern recognition like a musician rehearsing a riff until their fingers move without thought. In this way, nervous energy can transform into focus, and focus ultimately leads to reliable performance.
What separates successful traders from others?
This simple rehearsal habit sets apart traders who can spot a pattern from those who can turn it into consistent profits and losses.
What makes a pattern tradeable?
The next segment reveals what truly makes a pattern tradeable, not just visible. Understanding these factors will change how traders size and enter every signal.
What is the Best Way To Trade Using a Pattern?

Translate patterns into playbooks you can use when under pressure. This means you need to define the exact order choreography, check liquidity, and plan backup moves for every situation. Practice these steps until your body remembers them without thinking. View execution as the leading edge, as recognizing a pattern matters only when fills, timing, and sequence risk are handled reliably.
How does market microstructure affect how you trade a pattern?
Market structure changes the math behind a pattern. Thin bids and wide spreads can turn a calculated target into a gamble, while heavy algorithmic trading can push prices past a valid level, leaving your stop loss at risk. I coach traders to do three microstructure checks before any trigger: available resting size at your limit, the usual spread during the session you trade, and recent sweep behavior showing aggressive sellers or buyers.
Place limit orders in increasing sizes, plan for a “give” in your stop to handle one spike, and always account for expected slippage in your edge calculation. This changes a pattern’s theoretical R into a real R that you can capture. The widespread use of patterns means execution is a rare skill, as many traders compete for the same points. Therefore, the quality of execution sets winners apart from the crowd, not the pattern name.
When should you automate parts of the checklist, and when should a human make the decision?
Automation should handle broad, repetitive tasks, while humans handle more complex details. Use scripts to pre-validate candidates based on their structure, liquidity, and timeframe fit, and ensure there is a human-ready checklist to approve any live order. This combination reduces signal fatigue and stops blind execution. In practice, automation helps maintain consistency across sessions and reduces the risk of missed entries.
When paired with careful review, it becomes convenient, allowing you to focus on timing, position sizing, and any exceptions. When evaluation windows are tight, automated gating helps prevent emotional decisions and ensures your playbook's rules are followed, enabling many traders to turn regulations into results they can repeat. It's also beneficial to consider funded accounts for futures trading, as they provide the necessary capital, enhancing the effectiveness of your strategies.
How does familiarity with manual processes create friction?
Most teams use spreadsheets, screenshots, and manual checks because they are easy and cheap. However, as the number of signals increases, this familiarity leads to problems. Records get separated, decisions take longer, and consistency erodes.
Platforms like funded accounts for futures trading combine rule checks, maintain a single verified record of entries and fills, and provide faster feedback. This helps traders improve their pattern rules rather than get stuck in administrative issues.
How should you size and allocate patterns across correlated instruments?
Think in correlation buckets, not just individual setups. If two futures contracts show the exact triangle breakdown at the same time, they are not two separate bets; they represent one larger risk. Create a correlation matrix for the markets you trade, set a maximum exposure for each bucket, and use volatility parity to size positions based on the expected outcome of the pattern, instead of just your account balance.
Tiling can help: break a strong belief into 2–3 parts when signals confirm, securing a partial return while leaving space for the next momentum move. When an instrument’s microstructure can handle slippage consistently, reduce its allocation, even if the pattern's past win rate looks good. This balance between frequency and reliability acts as a helpful filter, preventing evaluation drawdowns rather than letting a bad streak wipe out your gains.
What rehearsal routine turns pattern sighting into dependable performance?
Simulate the entire sequence under constraints, timing it while measuring three key metrics in every session: checklist pass rate, time-to-fill, and realized R multiple. Conduct 30-minute drills where you load orders, verify liquidity, and execute until your entry choreography becomes automatic.
Treat the drill like a preflight checklist: confirm your bias, validate liquidity, place layered limits, set technical stops, and log outcomes without re-editing. The goal is to develop muscle memory, not to achieve perfect hindsight.
When the clock is running during an evaluation, this rehearsal can reduce hesitation, shrink execution errors, and prevent the mental cascade that occurs when a pattern first appears off, leading to second-guessing.
How do you handle the emotional push when a pattern looks perfect but the tape feels wrong?
That split second of doubt is a signal, not a flaw. If your checklist fails a single hard gate, downgrade the trade and walk away. Most destructive decisions come from adding size to recover from losses driven by emotions. Use a two-step mental checkpoint when entering a trade: breathe, read the liquidity snapshot, then commit.
If you cannot pass all three checks within fifteen seconds, the setup is not tradeable under live pressure. This practice helps to protect your capital and keeps your track record strong during the evaluation process.
What analogy can explain pattern execution?
Pattern execution is like landing a plane at a busy airport. Recognition helps to identify which runway to use. The microstructure gives information about wind conditions and other traffic. Automation adjusts the instruments for a careful approach, while rehearsal builds the muscle memory needed for a smooth landing, even in turbulence.
What are traders discovering about execution discipline?
Traders are uncovering a short curiosity loop that helps them move ahead. When they combine execution discipline with the right support, they undergo an unexpected, significant shift that changes everything about their scaling strategies.
Related Reading
- Fibonacci Trading Strategy
- Best Prop Trading Firms
- ORB Trading Strategy
- Crypto Swing Trading Strategy
- Best Copy Trading Platform
- Best Proprietary Trading Firms for Beginners
- Best Stocks for Options Trading
- Silver Bullet Trading Strategy
- Order Block Trading Strategy
- The Strat Trading Strategy
- Supply and Demand Trading Strategy
- Profitable Gold Trading Strategy
- Higher High Lower Low Trading Strategy
Unlock up to 50% off Your First Funded Account for Futures Trading
Turning pattern recognition into real capital requires significant effort. This includes adjusting strategies, practicing entries, and managing risk. Platforms like AquaFutures are essential for this.
They connect clear program rules with scalable funding and reliable payouts. Review their account options and current introductory offers to convert your recurring setups into a funded trading book.
